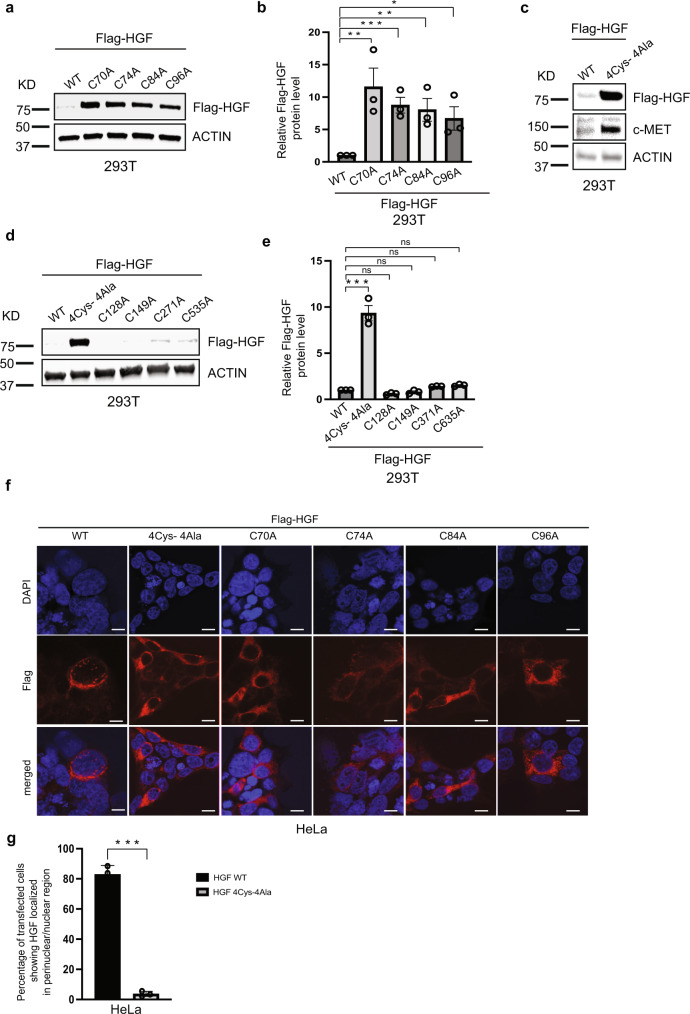
Fig. 1. PAN domain modulates HGF stability.
a, b Core cysteines in PAN domain are crucial for HGF stability. a Immunoblot analysis of whole cell lysates derived from 293T cells, transfected with Flag-HGF WT and different single cysteine mutants of Flag-HGF constructs as indicated. 30 h post-transfection, whole-cell lysates were prepared for immunoblot analysis. Representative image of n = 3 biological replicates. b Quantification of the band intensities in (a). The intensities of Flag-HGF (WT and mutants) bands were normalized to actin and then normalized to Flag-HGF WT. Data are represented as mean ± SEM, n = 3, and *p < 0.05, **p < 0.005, *** p < 0.0005 (student’s t-test). c Mutation in all four core cysteine residues in PAN domain remarkably alters HGF stability. Immunoblot analysis of whole cell lysates derived from 293 T cells, transfected with Flag-HGF WT and Flag-HGF 4Cys-4Ala constructs as indicated. 30 h post-transfection, whole-cell lysates were prepared for immunoblot analysis. d Cysteines in kringle domains and SPH domain of HGF have no impact on the protein abundance in cells. Immunoblot analysis of whole cell lysates derived from 293T cells, transfected with Flag-HGF WT, Flag-HGF 4Cys-4Ala, and different single cysteine mutants of Flag-HGF constructs as indicated. 30 h post-transfection, whole-cell lysates were prepared for immunoblot analysis. Representative image of n = 3 biological replicates. e Quantification of the band intensities in (d). The intensities of Flag-HGF (WT and mutants) bands were normalized to actin and then normalized to Flag-HGF WT. Data are represented as mean ± SEM, n = 3, and *p < 0.05, **p < 0.005, ***p < 0.0005 (student’s t-test). f Localization of Flag-HGF WT and different Flag-HGF mutants’ expression by confocal immunofluorescence microscopy in HeLa cells. The cells were transiently transfected with Flag-HGF WT and different mutants of Flag-HGFs as indicated. 30 h post-transfection cells were fixed, mounted and protein expression patterns were visualized using a Zeiss LSM 710 confocal microscope outfitted with a 63× objective. Scale bars represent 20 μm. The images shown are representative from three independent biological experiments (average 100 cells were observed per experimental condition per replicate). g Percentage of transfected HeLa cells showing perinuclear/nuclear staining for Flag-HGF WT and Flag-HGF 4Cys-4Ala were quantified. Data are represented as mean ± SD, n = 3 (average 100 cells were observed for each condition per experiment), and *p < 0.05, **p < 0.005, *** p < 0.0005 (Student’s t test).

