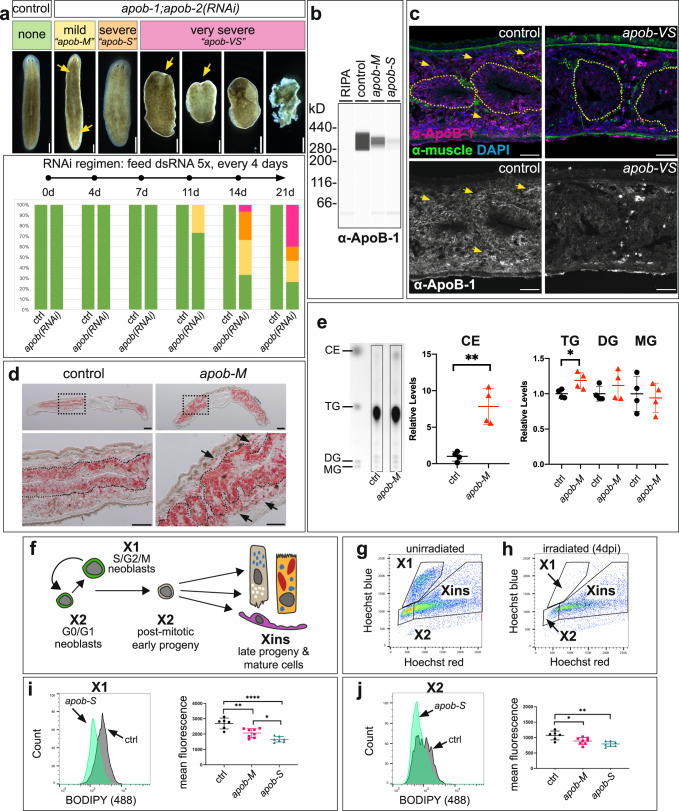
Fig. 2. apob orthologs are required for viability and neutral lipid metabolism.
a Simultaneous RNAi-mediated knockdown of apob-1 and apob-2 caused mild (“apob-M”) (yellow) and severe (“apob-S”) (orange) depigmentation, and very severe (“apob-VS”) (pink) phenotypes including head regression, ventral curling, and lysis. n = 15 animals per condition, representative of >10 experiments. b Simple Western (capillary-based protein analysis) lane view of extracts from control and knockdown planarians labeled with custom anti-ApoB-1. Representative of one experiment with three biological replicates per condition. Uncropped Wes data are in Source Data. c ApoB-1 protein expression (magenta), sagittal sections. Expression inside (dotted outline) and outside the intestine (arrows) was reduced in apob-1(RNAi);apob-2(RNAi) planarians (right panels) (7 days after the last dsRNA feeding). mAb 6G10 (green) labeled visceral and other muscle fibers. Representative of four independent labeling experiments, n = 1 animal per condition (>8 sections per animal). d Neutral lipids (red) accumulated in the intestine (dashed outlines) and parenchyma (arrows) of “mild” apob(RNAi) planarians (7 days after last dsRNA feeding). Oil Red O labeling, sagittal sections. Representative of two independent experiments, n = 1-2 animals per condition (>10 sections per animal). e Cholesteryl esters (CE) and triglycerides (TG), but not diacylglycerides (DG) or monoglycerides (MG) were significantly elevated in “mild” apob(RNAi) animals. Thin layer chromatography quantification. Student’s t test (unpaired, two-tailed); **p = 0.0017 (CE) and *p = 0.0303 (TG). Error bars: mean ± S.D., n = 4 biological replicates, representative of two independent experiments. Uncropped TLC plate is provided in Source Data. f Lineage schematic indicating cell types in X1, X2, and Xins subpopulations. g Example flow plot for uninjured animals. h Example plot for animals 4 days post irradiation (“4 dpi”), showing ablation of cells in X1 and depletion of cells in X2. i, j apob knockdown caused reduction of neutral lipids in X1 and X2 cells. One-way ANOVA with Tukey’s multiple comparisons test. Error bars: mean ± S.D., n = 6 (control), 8 (apob-M), or 7 (apob-S) biological replicates per condition. i *p = 0.0275, **p = 0.0018, ****p < 0.0001. j *p = 0.0216, **p = 0.001. Data are representative of two independent experiments. Scale bars: 50 µm (c); 200 µm (d upper panels); 100 µm (d lower panels).

