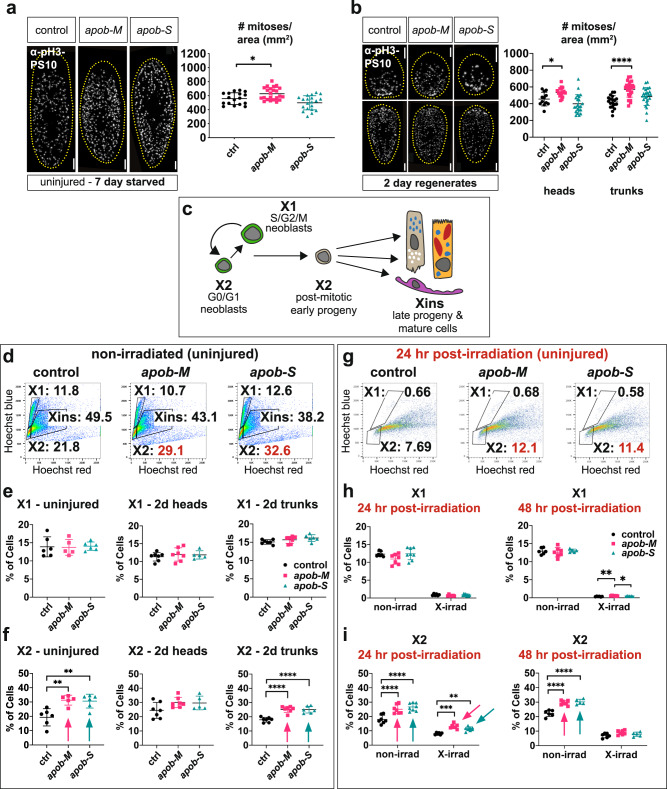
Fig. 4. apob inhibition causes accumulation of neoblast progeny.
a, b PhosphoHistone-H3-S10-positive (pH3-PS10) cells (white/gray) were modestly elevated in apob-M (“mild”), but not apob-S (“severe”), uninjured animals (a) and 2-day regenerates (b). One-way ANOVA with Dunnett’s T3 multiple comparisons test. Error bars: mean ± S.D. a n = 17 (control), 23 (apob-M), 20 (apob-S) biological replicates. *p = 0.0304. b Heads: n = 12 (control), 17 (apob-M), 22 (apob-S) biological replicates. *p = 0.0342. Tails: n = 19 (control), 24 (apob-M), 25 (apob-S) biological replicates. ****p < 0.0001. Representative of two independent experiments. Scale bars: 200 µm. c Lineage schematic indicating cell types/states in X1, X2, and Xins subpopulations. d Examples of flow dot plots from uninjured planarians indicating percentages of cells in each gate, with X2 increase in apob(RNAi) animals in red. Percentage of cells in X1 (e) and X2 (f) in uninjured (left), 2-day head (middle), and 2-day trunk (right) regenerates. Arrows indicate statistically significant increases in X2. One-way ANOVA with Tukey’s multiple comparisons test. Error bars: mean ± S.D, n ≥ 5 biological replicates per condition. Dots in plots represent exact n values, also provided in Source Data. **p = 0.004, ****p < 0.0001. Representative of 5 (uninjured) or 2 (regenerates) independent experiments. g Examples of flow plots from uninjured planarians, 24 h post-irradiation, indicating percentages of cells in each gate, with X2 increase in apob(RNAi) animals in red. Percentage of cells in X1 (h) and X2 (i) in uninjured planarians, 24 h (left) and 48 h (right) post-irradiation. Arrows indicate significant increases in X2. For X1 and X2 non-irradiated samples, and X1 irradiated samples (h and i): one-way ANOVA and Tukey’s multiple comparisons test (*p = 0.0211; **p = 0.0022; ****p < 0.0001). Differences between RNAi conditions in X1 at 48 h post-irradiation were significant (*p = 0.0211; *p = 0.0022), but percent of cells in this gate was negligible (<0.7% in all samples). For X2 irradiated samples (i): two-way ANOVA and two-stage linear step-up procedure of Benjamini, Krieger and Yekutieli for multiple comparisons (**q = 0.0049, ***q = 0.0004). Error bars: mean ± S.D, n ≥ 5 biological replicates per condition. Dots in plots represent exact n values, also provided in Source Data. Data from one experiment. Statistical analyses are provided in Source Data.

