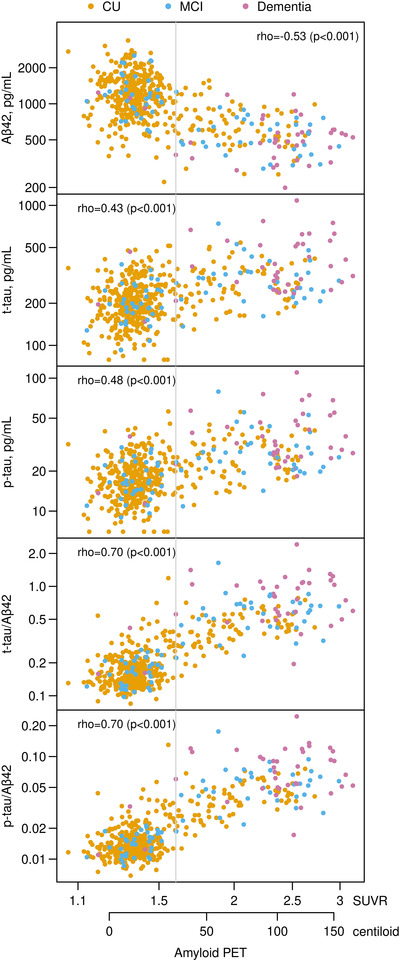
FIGURE 1.

Scatter plots of the cerebrospinal fluid (CSF) biomarkers versus amyloid Positron Emission Tomography (PET) with rank correlations. Individual points are colored by clinical diagnosis CU = cognitively unimpaired, MCI = Mild Cognitive Impairment). The gray vertical line represents the amyloid PET cut point of 1.6 Standard Uptake Value Ratio (SUVR, 32 centiloid)
