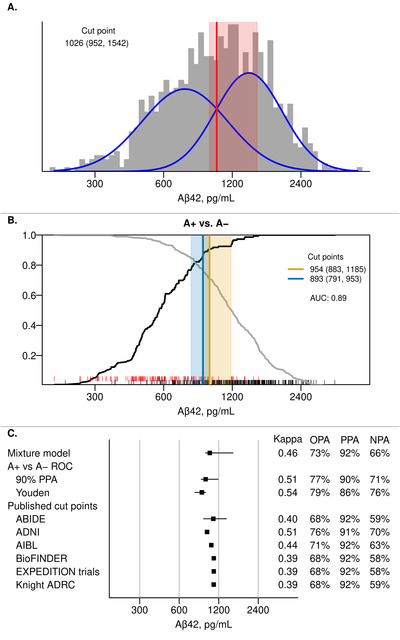
FIGURE 2.

CSF Aβ42 cut points. Panel A shows a histogram of Aβ42 in the CSF cohort with estimated probability density curves of the two groups identified through univariate mixture modeling (blue). The optimal cut point with 95% bootstrap confidence interval is shown in red. Panel B shows the positive percent agreement (PPA, black line) and negative percent agreement (NPA, gray line) for Aβ42 from an Receiving Operating Characteristic (ROC) analysis using A+ versus A− as the reference within the CSF + PET subset. A+ was defined as amyloid PET ≥1.60 SUVR (32 centiloid). The cut point (95% bootstrap confidence interval) that results in 90% PPA is shown in orange and the Youden method cut point is shown in blue. Rug plots at the bottom of each panel indicate Aβ42 values for A+ (red) and A− (black) individuals. Panel C summarizes the Aβ42 cut points from Panels A and B as well as performance of previously published cut points in our cohort. 8 , 9 , 10 , 11 , 12 These cut points were: 1092 pg/mL for Alzheimer's Biomarkers In Daily PracticE (ABIDE), 977 pg/mL for Alzheimer's Disease Neuroimaging Initiative (ADNI), 1054 pg/mL for the Australian Imaging, Biomarker & Lifestyle Flagship Study of Ageing (AIBL), 1100 pg/mL for Biomarkers For Identifying Neurodegenerative Disorders Early and Reliably (BioFINDER), 1100 pg/mL for the EXPEDITION trials, and 1098 pg/mL for the Knight Alzheimer's Disease Research Center (ADRC). 8 , 9 , 10 , 11 , 12 Kappa, overall percent agreement (OPA), positive percent agreement (PPA), and negative percent agreement (NPA) are reported with amyloid PET (A+ vs A−) as reference.
