
FIGURE 3.
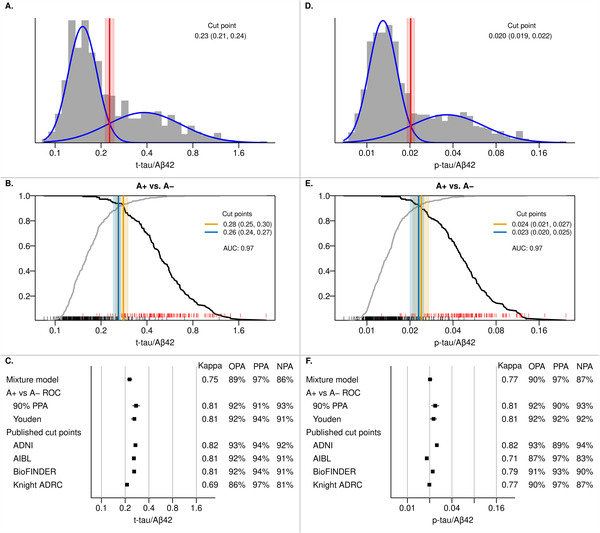
CSF T‐tau/Aβ42 and P‐tau/Aβ42 cut points. Panels A and D show the histograms of t‐tau/Aβ42 and p‐tau/Aβ42 in the CSF cohort with estimated probability density curves of the two groups identified through univariate mixture modeling (blue). The optimal cut point with 95% bootstrap confidence interval is shown in red. Panels B and E show the positive percent agreement (PPA, black line) and negative percent agreement (NPA, gray line) for t‐tau/Aβ42 and p‐tau/Aβ42, respectively, from an ROC analysis using A+ versus A− as the reference within the CSF + PET subset. A+ was defined as amyloid PET ≥1.60 SUVR (32 centiloid). The cut point (95% bootstrap confidence interval) that results in 90% PPA is shown in orange and the Youden method cut point is shown in blue. RUG plots at the bottom of each panel indicate CSF values for A+ (red) and A− (black) individuals. Panels C and F summarize the t‐tau/Aβ42 and p‐tau/Aβ cut points, respectively, from the previous panels and the performance of previously published cut‐points in our cohort. 8 , 9 , 10 For t‐tau/Aβ42, these cut points were 0.27 for ADNI, 0.258 for AIBL, 0.26 for BioFINDER, and 0.211 for the Knight ADRC. 8 , 9 , 10 For p‐tau/Aβ42, these cut points were 0.025 for ADNI, 0.0183 for AIBL, 0.022 for BioFINDER, and 0.0198 for the Knight ADRC. Kappa, overall percent agreement (OPA), PPA, and NPA with amyloid PET as reference (A+ vs A−) are reported.