
FIGURE 4.
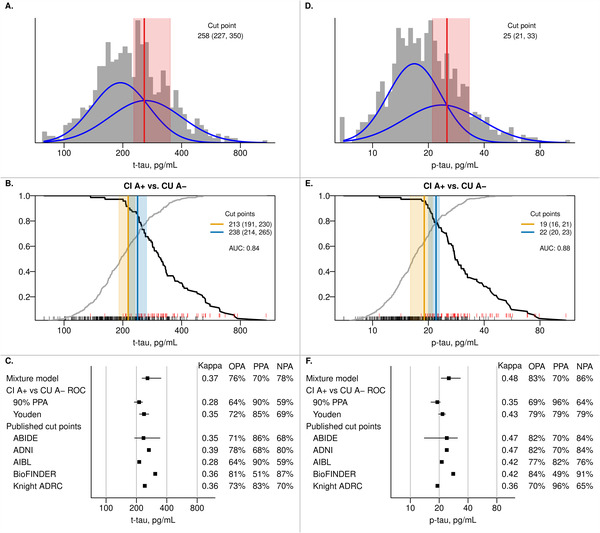
CSF t‐tau and p‐tau cut points. Panels A and D show the histograms of t‐tau and p‐tau in the cerebrospinal fluid (CSF) cohort with estimated probability density curves of the two groups identified through univariate mixture modeling (blue). The optimal cut point with 95% bootstrap confidence interval is shown in red. Panels B and E show the positive percent agreement (PPA, black line) and negative percent agreement (NPA, gray line) for t‐tau and p‐tau, respectively, from an receiver‐operating characteristic (ROC) analysis using cognitively impaired (CI) A+ versus cognitively unimpaired (CU) A− as the reference within the CSF + PET subset (see Methods – Statistical Analysis for more information). A+ was defined as amyloid PET ≥1.60 SUVR (32 centiloid). The cut point (95% bootstrap confidence interval) that results in 90% PPA is shown in orange and the Youden method cut point is shown in blue. RUG plots at the bottom of each panel indicate CSF values for CI A+ (red) and CU A− (black) individuals. Panels C and F summarize the t‐tau and p‐tau cut points, respectively, from the previous panels as well as performance of previously published cut points in our cohort. For t‐tau, these cut points were 235 pg/mL for ABIDE, 266 pg/mL for ADNI, 213 pg/mL for AIBL, 307 pg/mL for BioFINDER, and 242 pg/mL for the Knight ADRC. 8 , 10 , 12 , 13 For p‐tau, these were 24 pg/mL for ABIDE, 24 pg/mL for ADNI, 21.3 pg/mL for AIBL, 28 pg/mL for BioFINDER, and 19.2 pg/mL for the Knight ADRC. 8 , 10 , 12 , 13 Kappa, overall percent agreement (OPA), PPA, and NPA with CI A+ versus CU A− as the reference are reported.