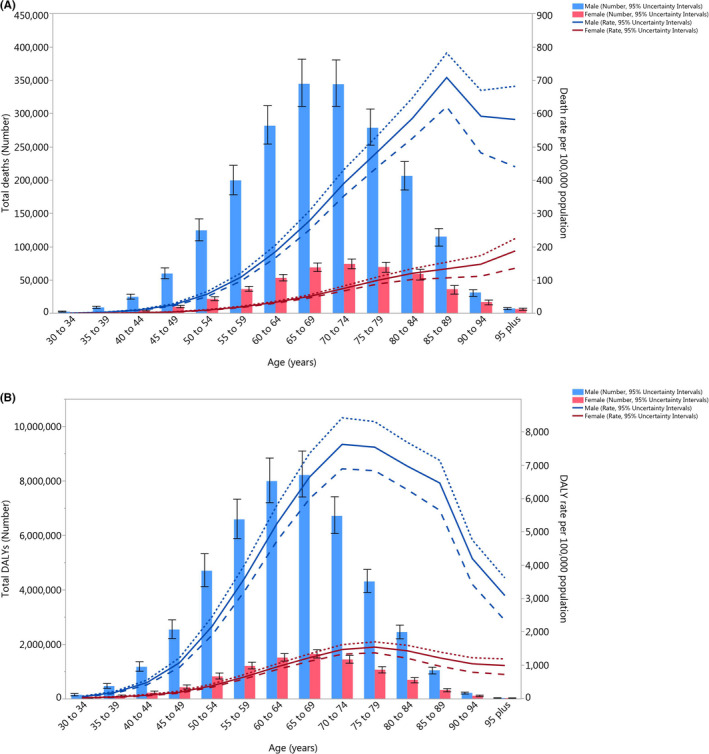
FIGURE 3.

Global number of deaths and death rate (A) and global number of DALYs and DALY rate (B) of cancers attributable to smoking per 100,000 population by age and sex in 2019; Dotted and dashed lines indicate 95% upper and lower uncertainty intervals, respectively. DALY, disability‐adjusted life years. (Generated from data available from http://ghdx.healthdata.org/gbd‐results‐tool)
