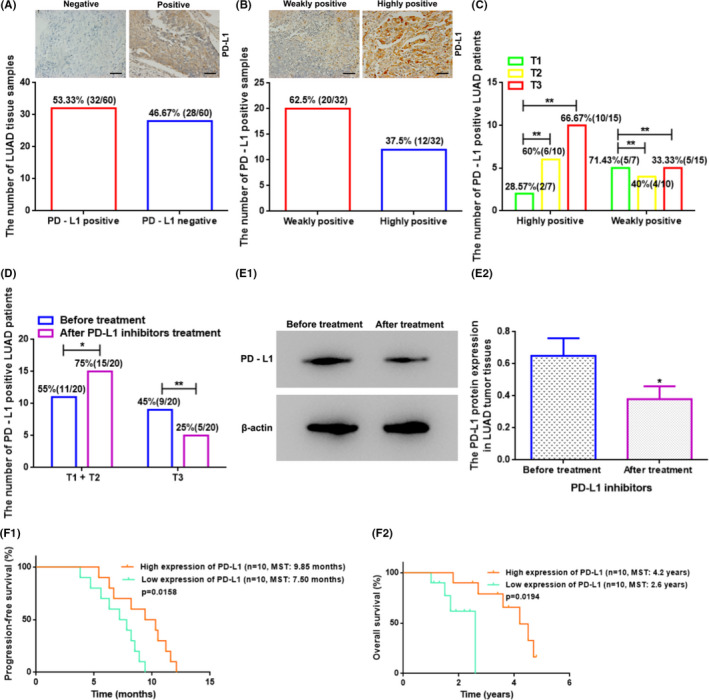
FIGURE 2.

The PD‐L1 protein expression level in the LUAD tissues was associated with the T stage/tumor size stage and the therapeutic effect of PD‐L1 inhibitors treatment. (A) The number of PD‐L1‐positive and PD‐L1‐negative LUAD tissue samples detected by IHC. Superjacent figure: Representative images of IHC for PD‐L1‐positive and PD‐L1‐negative LUAD tissues. Scale bars: 50 μm. (B) The number of PD‐L1‐weakly positive and ‐highly positive LUAD tissue samples detected by IHC. Superjacent figure: Representative figures of IHC for PD‐L1‐weakly positive and ‐highly positive LUAD tissues. Scale bars: 50 μm. (C) The PD‐L1 level was related to the T stage in PD‐L1‐positive LUAD sufferers. T: primary tumor; T stage: tumor size stage; T1, T2, and T3 stage: tumor diameter size of primary tumor ≤3 cm, =3–5 cm, and >7 cm, respectively. ** vs. T1, p < 0.01. (D) The number of PD‐L1‐positive LUAD patients with different tumor size stages before and after treatment with PD‐L1 inhibitors. *p < 0.05; ** vs. before treatment, p < 0.01. (E) The PD‐L1 protein level in the LUAD tumor tissues before and after treatment with PD‐L1 inhibitors. * vs. before treatment, p < 0.05. (F) The relationship between PD‐L1 level and PFS/OS after PD‐L1 inhibitor treatment in PD‐L1‐positive LUAD sufferers. LUAD, lung adenocarcinoma; PD‐L1, programmed cell death ligand‐1; MST, median survival time
