FIGURE 6.

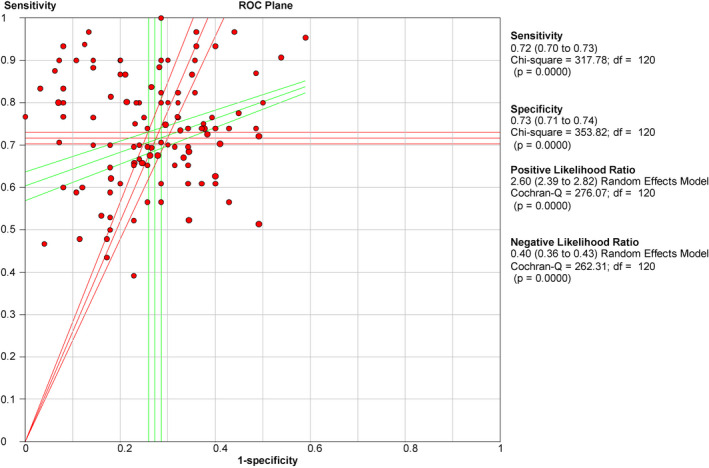
ROC plane curve for the salivary diagnosis of BC revealed the threshold effects between the pooled sensitivity and 1‐specificity

ROC plane curve for the salivary diagnosis of BC revealed the threshold effects between the pooled sensitivity and 1‐specificity