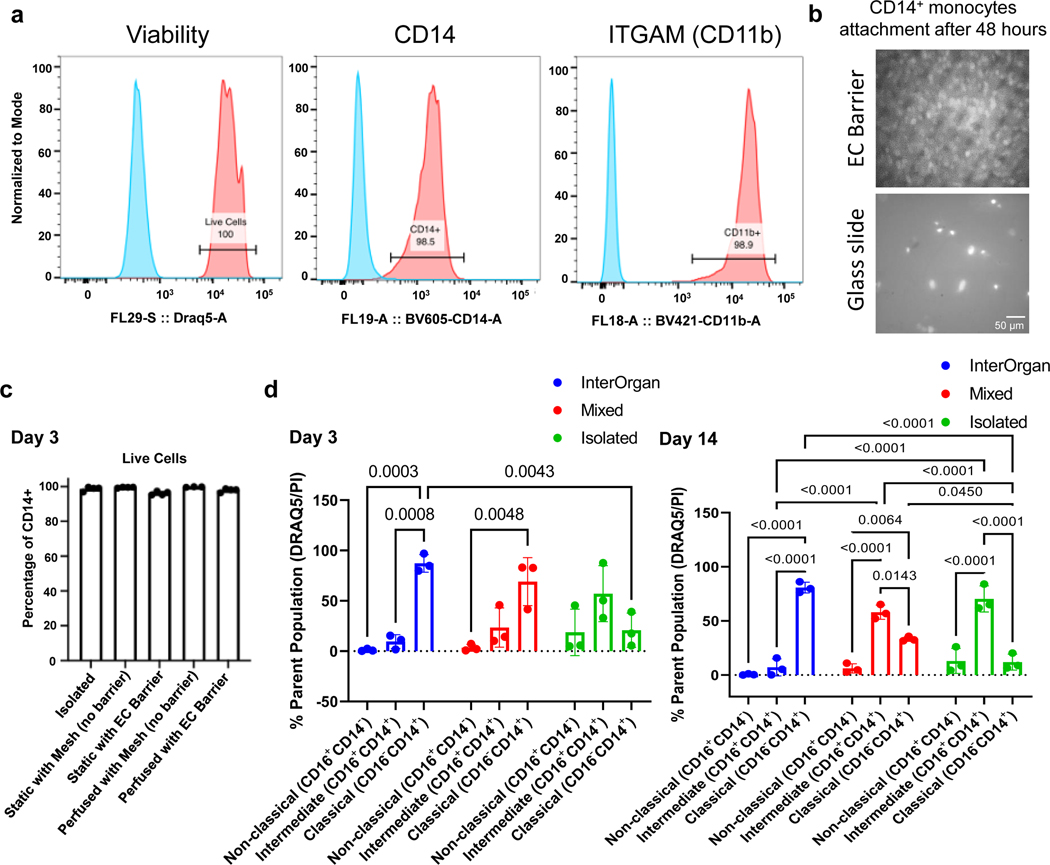
Extended Data Figure 5 |. Immune cell isolation, maturation, and characterization.
a, Initial cell population was made up of >98% CD14+, ITGAM+ monocytes. b, Brightfield image detailing monocyte adherence to barrier surface within platform. c, Flow cytometry characterization of monocyte viability after 3 days of culture (n=3–4 biological replicates). d, Monocyte specification and differentiation over two weeks of culture (n=3 biological replicates). Data is shown as mean ± SD and statistics determined by two-way ANOVA.

