
Figure 4 |. InterOrgan tissue chip demonstrates maintenance of structural, functional, and molecular phenotypes for each engineered organ over 4 weeks following linking of tissues by vascular flow.
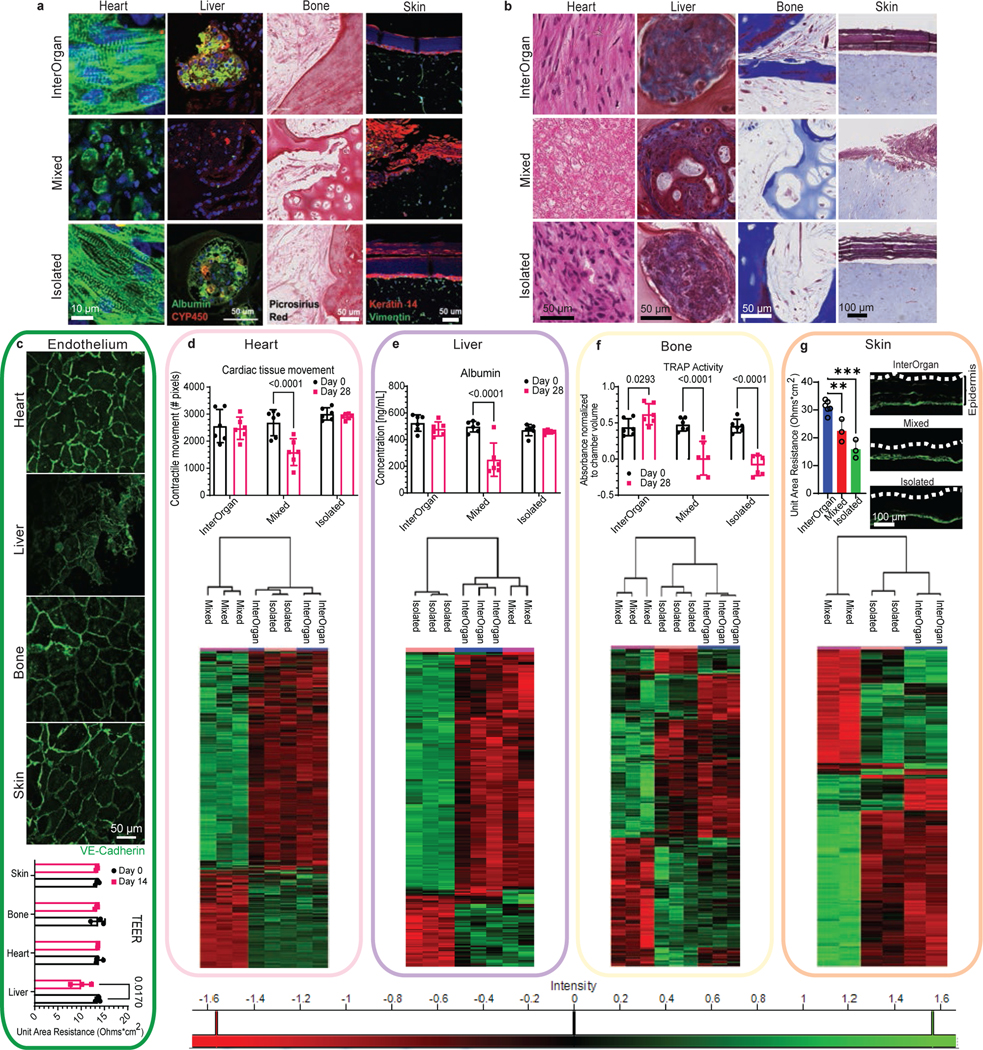
a-b, Representative immunofluorescence staining (a) and trichrome histological staining (b) displays morphological differences between groups (Scale bar, 50 μm for heart, liver, and bone; 100 μm for skin). c, Vascular stability is maintained after 4 weeks in culture as shown by VE-Cadherin expression (green). Scale bar, 50 μm. Transendothelial electrical resistance (TEER) measurements of the endothelial barrier (n=3 biological replicates). d-g, Functional (n=6 biological replicates) and overall proteomic comparison of molecular features (n=2–3 biological replicates) for each engineered organ compared in each condition. Immunostains showing the epidermal layer of the skin. Scale bar, 100 μm, Data is shown as mean ± SD and statistics determined by two-way ANOVA.