
Figure 2.
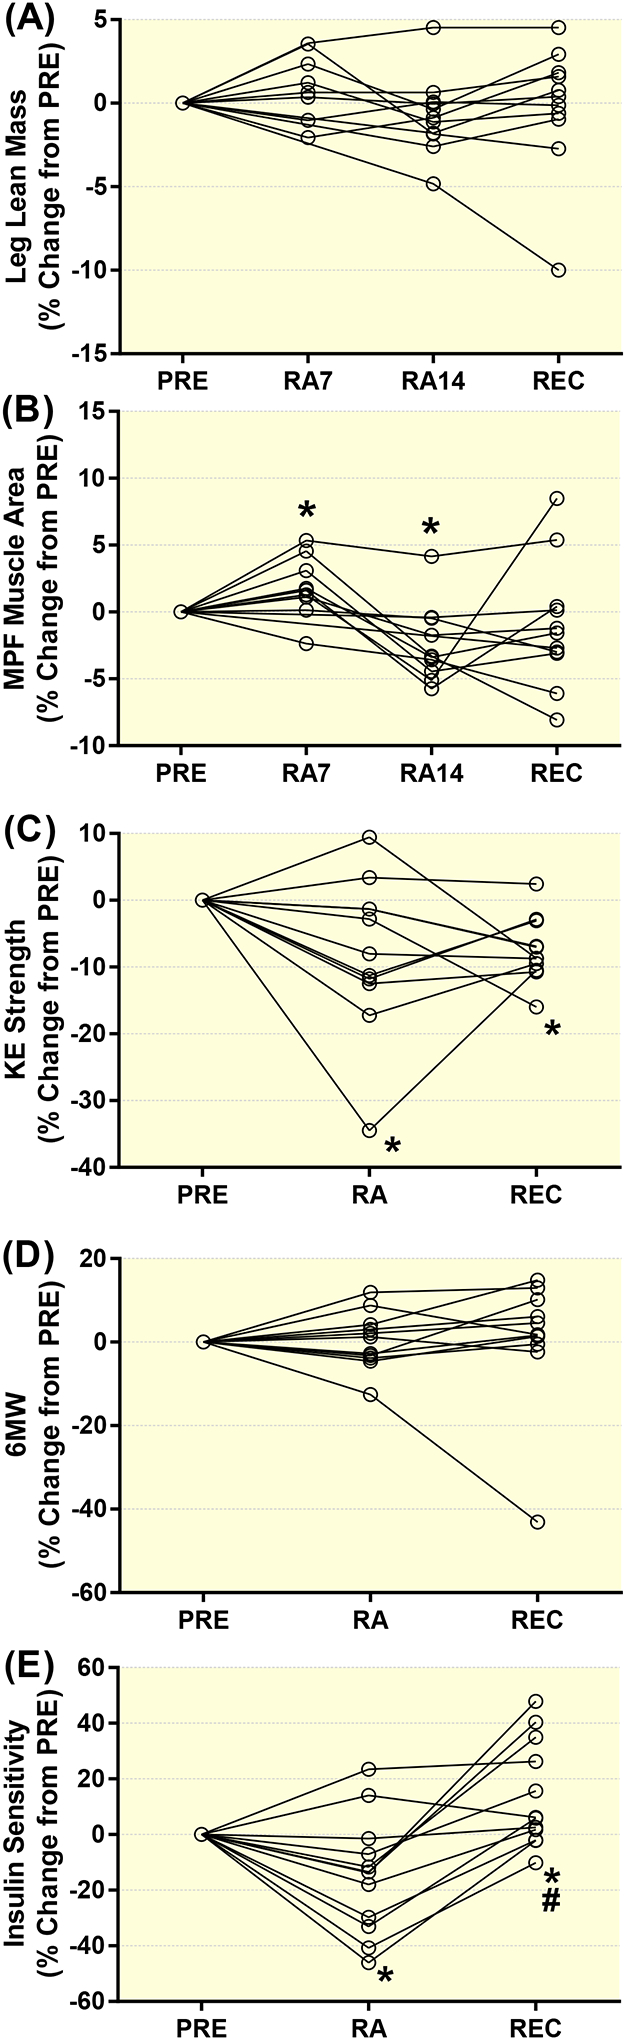
Individual responses for the percent change from PRE during reduced activity (RA7 and RA14) and after recovery (REC) in healthy older adults for leg lean mass (A), mid-plantar flexor (MPF) muscle area (B), knee extension strength (C), 6 minute walk test (D) and glucose infusion rate (insulin sensitivity, E). Data are Mean±SEM. Mid-plantar flexor, MPF; knee extension, KE; 6 minute walk test, 6WT. * P<0.05 vs PRE. # P<0.05 vs RA.