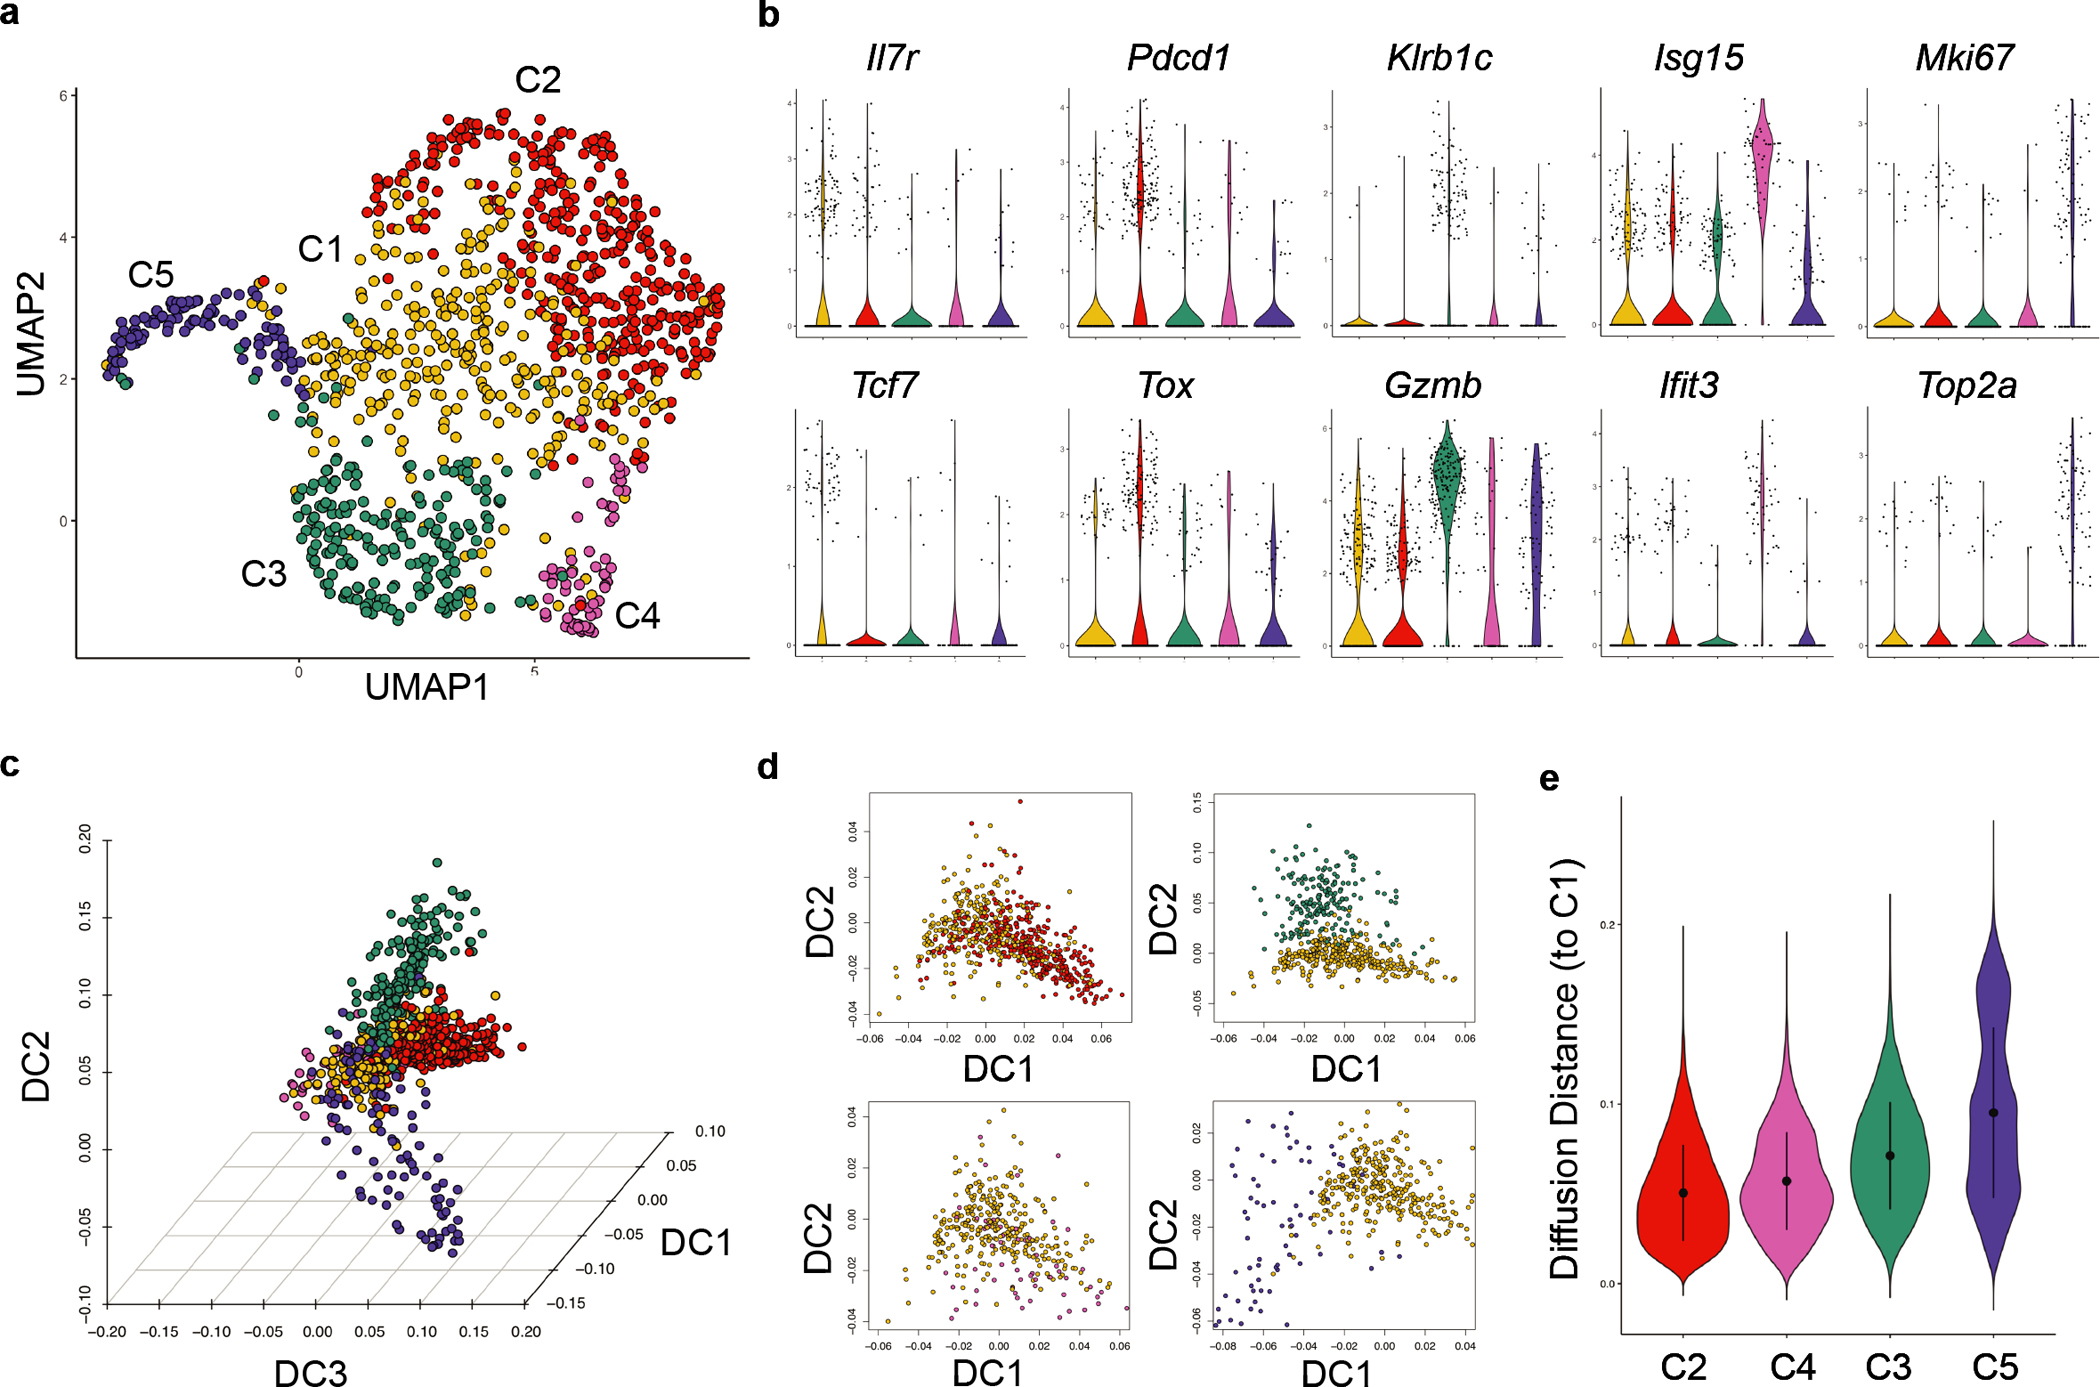
Figure 1. Characterization of tumor-infiltrating CD8+ T cells.

a, Uniform manifold approximation and projection (UMAP) of CD45+TCRβ+CD8α+ lymphocytes in breast tumor tissues from PyMT mice. Clusters (C) are denoted by color. b, Violin plots comparing expression of signature genes of indicated clusters. c, Three-dimensional diffusion embedding generated using clusters C1-C5 cells. d, Visualization of diffusion component (DC) analysis comparing the gene expression programs of cells from C2-C5 to that of C1 cells. e, Diffusion distance from C2-C5 cells to C1 cells. Statistical differences between the distribution of diffusion distances for each pair of clusters were calculated using a two-sided Wilcoxon test with P < 2.2e-16 between C2 and C4, C2 and C3, and C2 and C5.
