
Extended Data Figure 6. αβILTCk development is cDC1-independent.
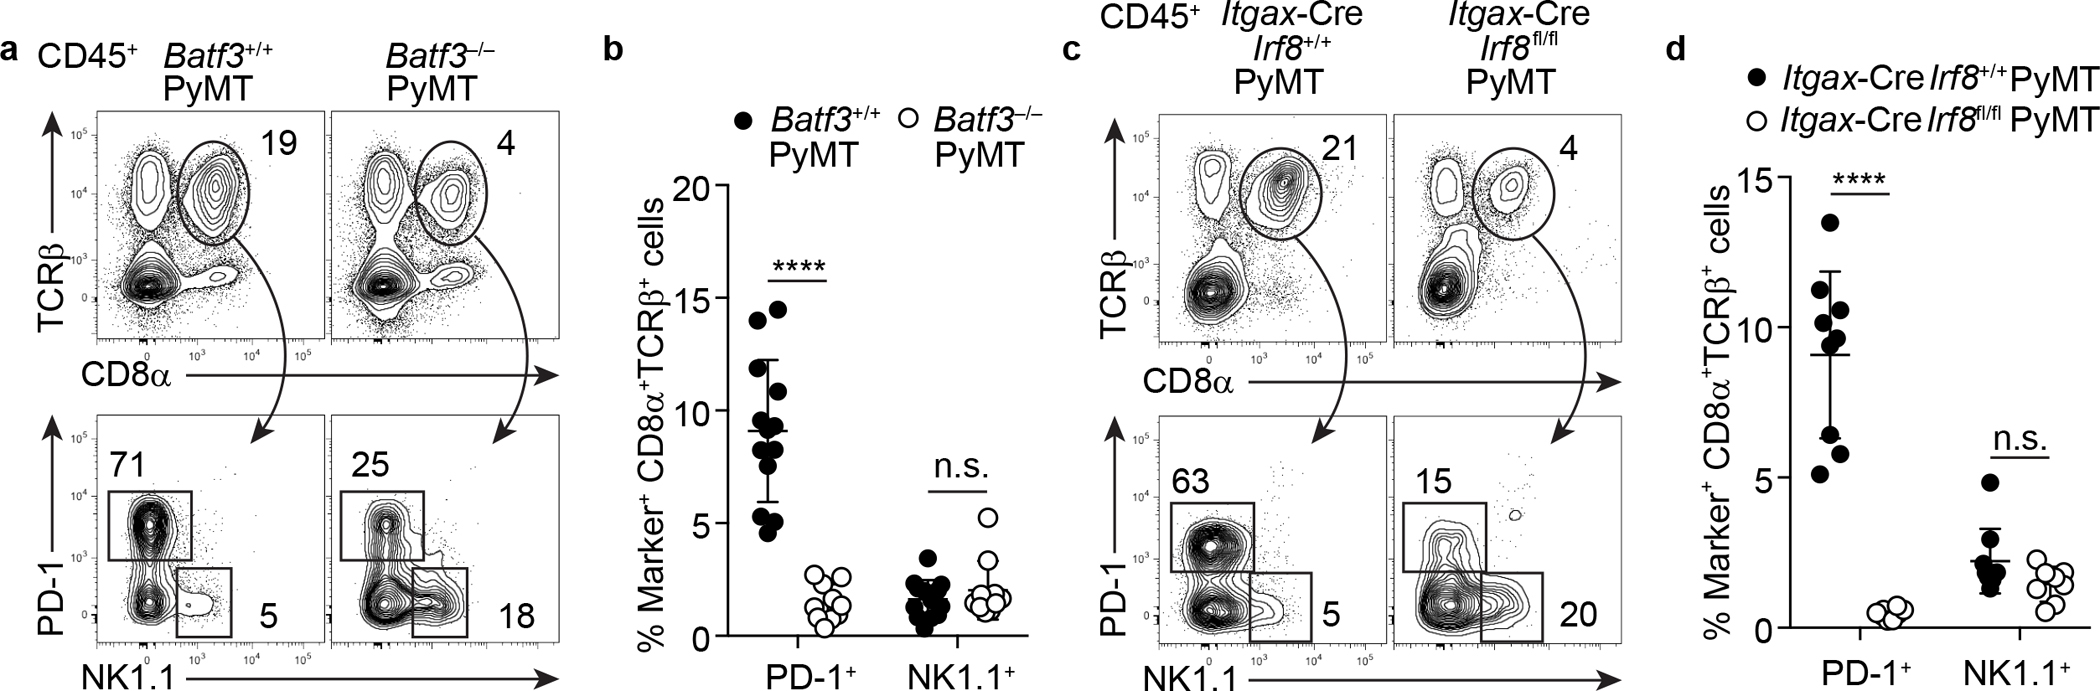
a, Flow cytometric analysis of TCRβ, CD8α, PD-1, and NK1.1 expression in tumor-infiltrating CD45+ cells from Batf3−/−PyMT (n = 10) and control Batf3+/+PyMT mice (n = 13). b, Frequency of tumor-infiltrating PD-1+ T cells and αβILTCks in mice of indicated genotypes. c, Flow cytometric analysis of TCRβ, CD8α, PD-1, and NK1.1 expression in tumor-infiltrating CD45+ cells from Itgax-CreIrf8fl/flPyMT (n = 8) and control Itgax-CreIrf8+/+PyMT mice (n = 9). d, Frequency of tumor-infiltrating PD-1+ T cells and αβILTCks in mice of indicated genotypes. All statistical data are shown as mean ± S.D (biologically independent mice in a-d). Two-tailed unpaired t-test in b,d. ****P < 0.0001 and n.s.: not significant.