
Figure 4. FCER1G expression marks cells of the αβILTCk-lineage.
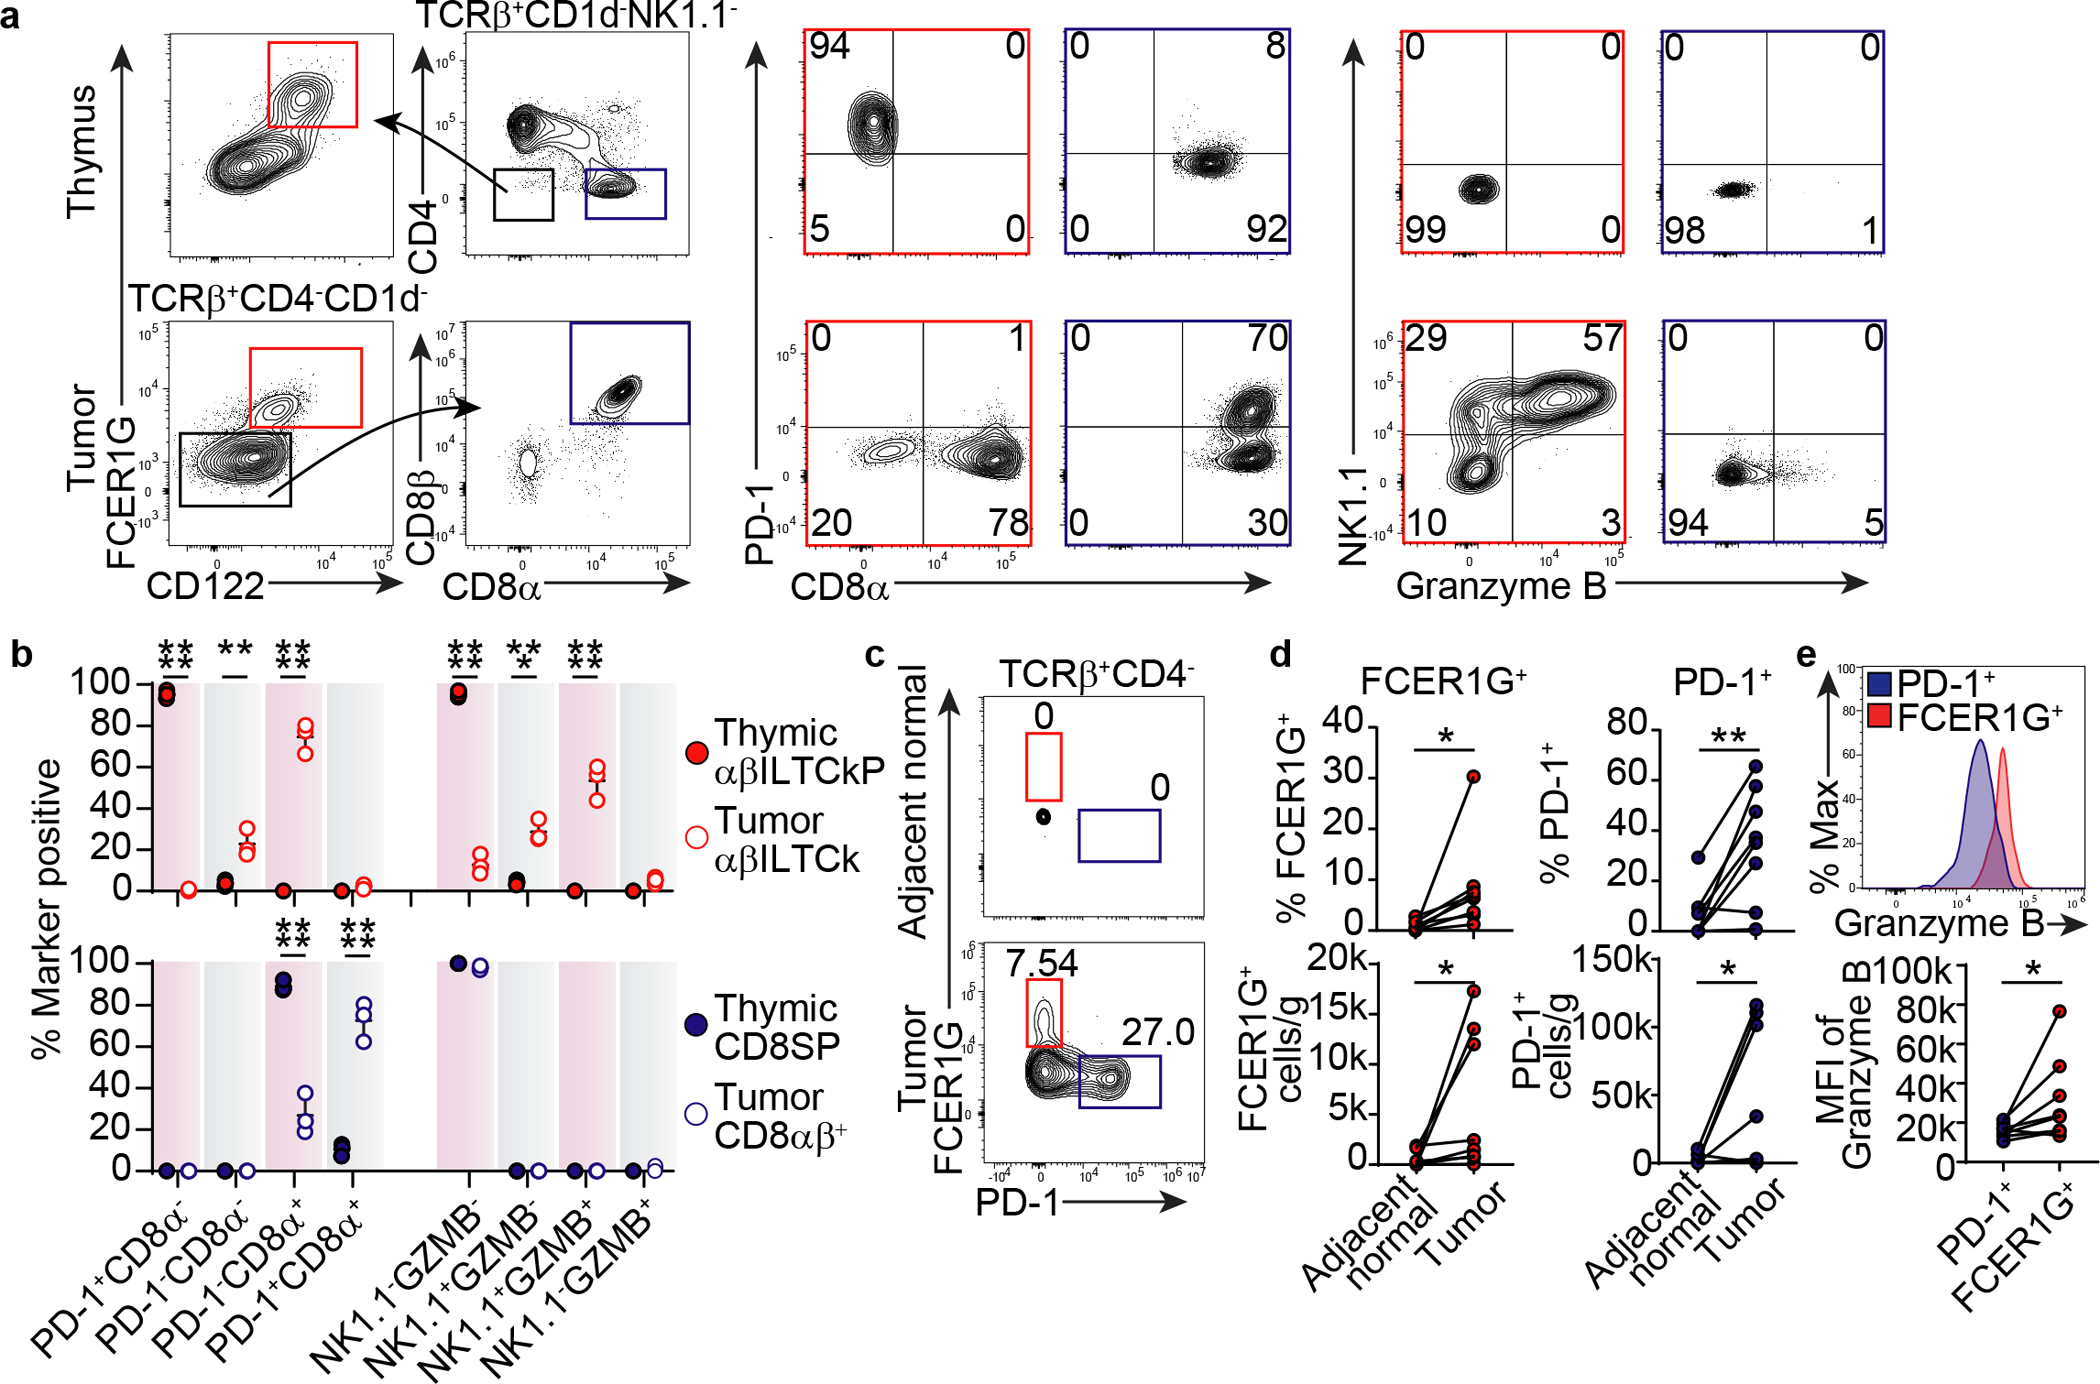
a-b, Flow cytometric analysis of FCER1G, CD122, CD4, CD8α, CD8β, PD-1, NK1.1, and granzyme B expression in TCRβ+CD1d−NK1.1− thymocytes and TCRβ+CD4−CD1d− tumor-infiltrating T cells from PyMT mice (n = 3). Frequency of thymic FCER1G+CD122+ αβILTCk progenitor (αβILTCkP), intratumoral αβILTCk, thymic CD8 single positive (CD8SP), and intratumoral CD8αβ+ T cells expressing indicated combination of markers are plotted. c-d, Expression of FCER1G and PD-1 by CD45+TCRβ+CD4− cells in tumor tissues or adjacent normal colon from patients with colon carcinoma (n = 8). e, Granzyme B expression in FCER1G+TCRβ+ and PD-1+TCRβ+CD4− cells in tumor tissues from patients with colon carcinoma (n = 8). All statistical data are shown as mean ± S.D (biologically independent mice in a-b and human samples in c-e). Two-tailed un-paired (b) and paired t-test (d-e). *P < 0.05; **P < 0.01; ***P < 0.001 and ****P < 0.0001.