
Extended Data Figure 3. Recognition of cancer cell antigens by NK1.1+ αβILTCk-TCRs.
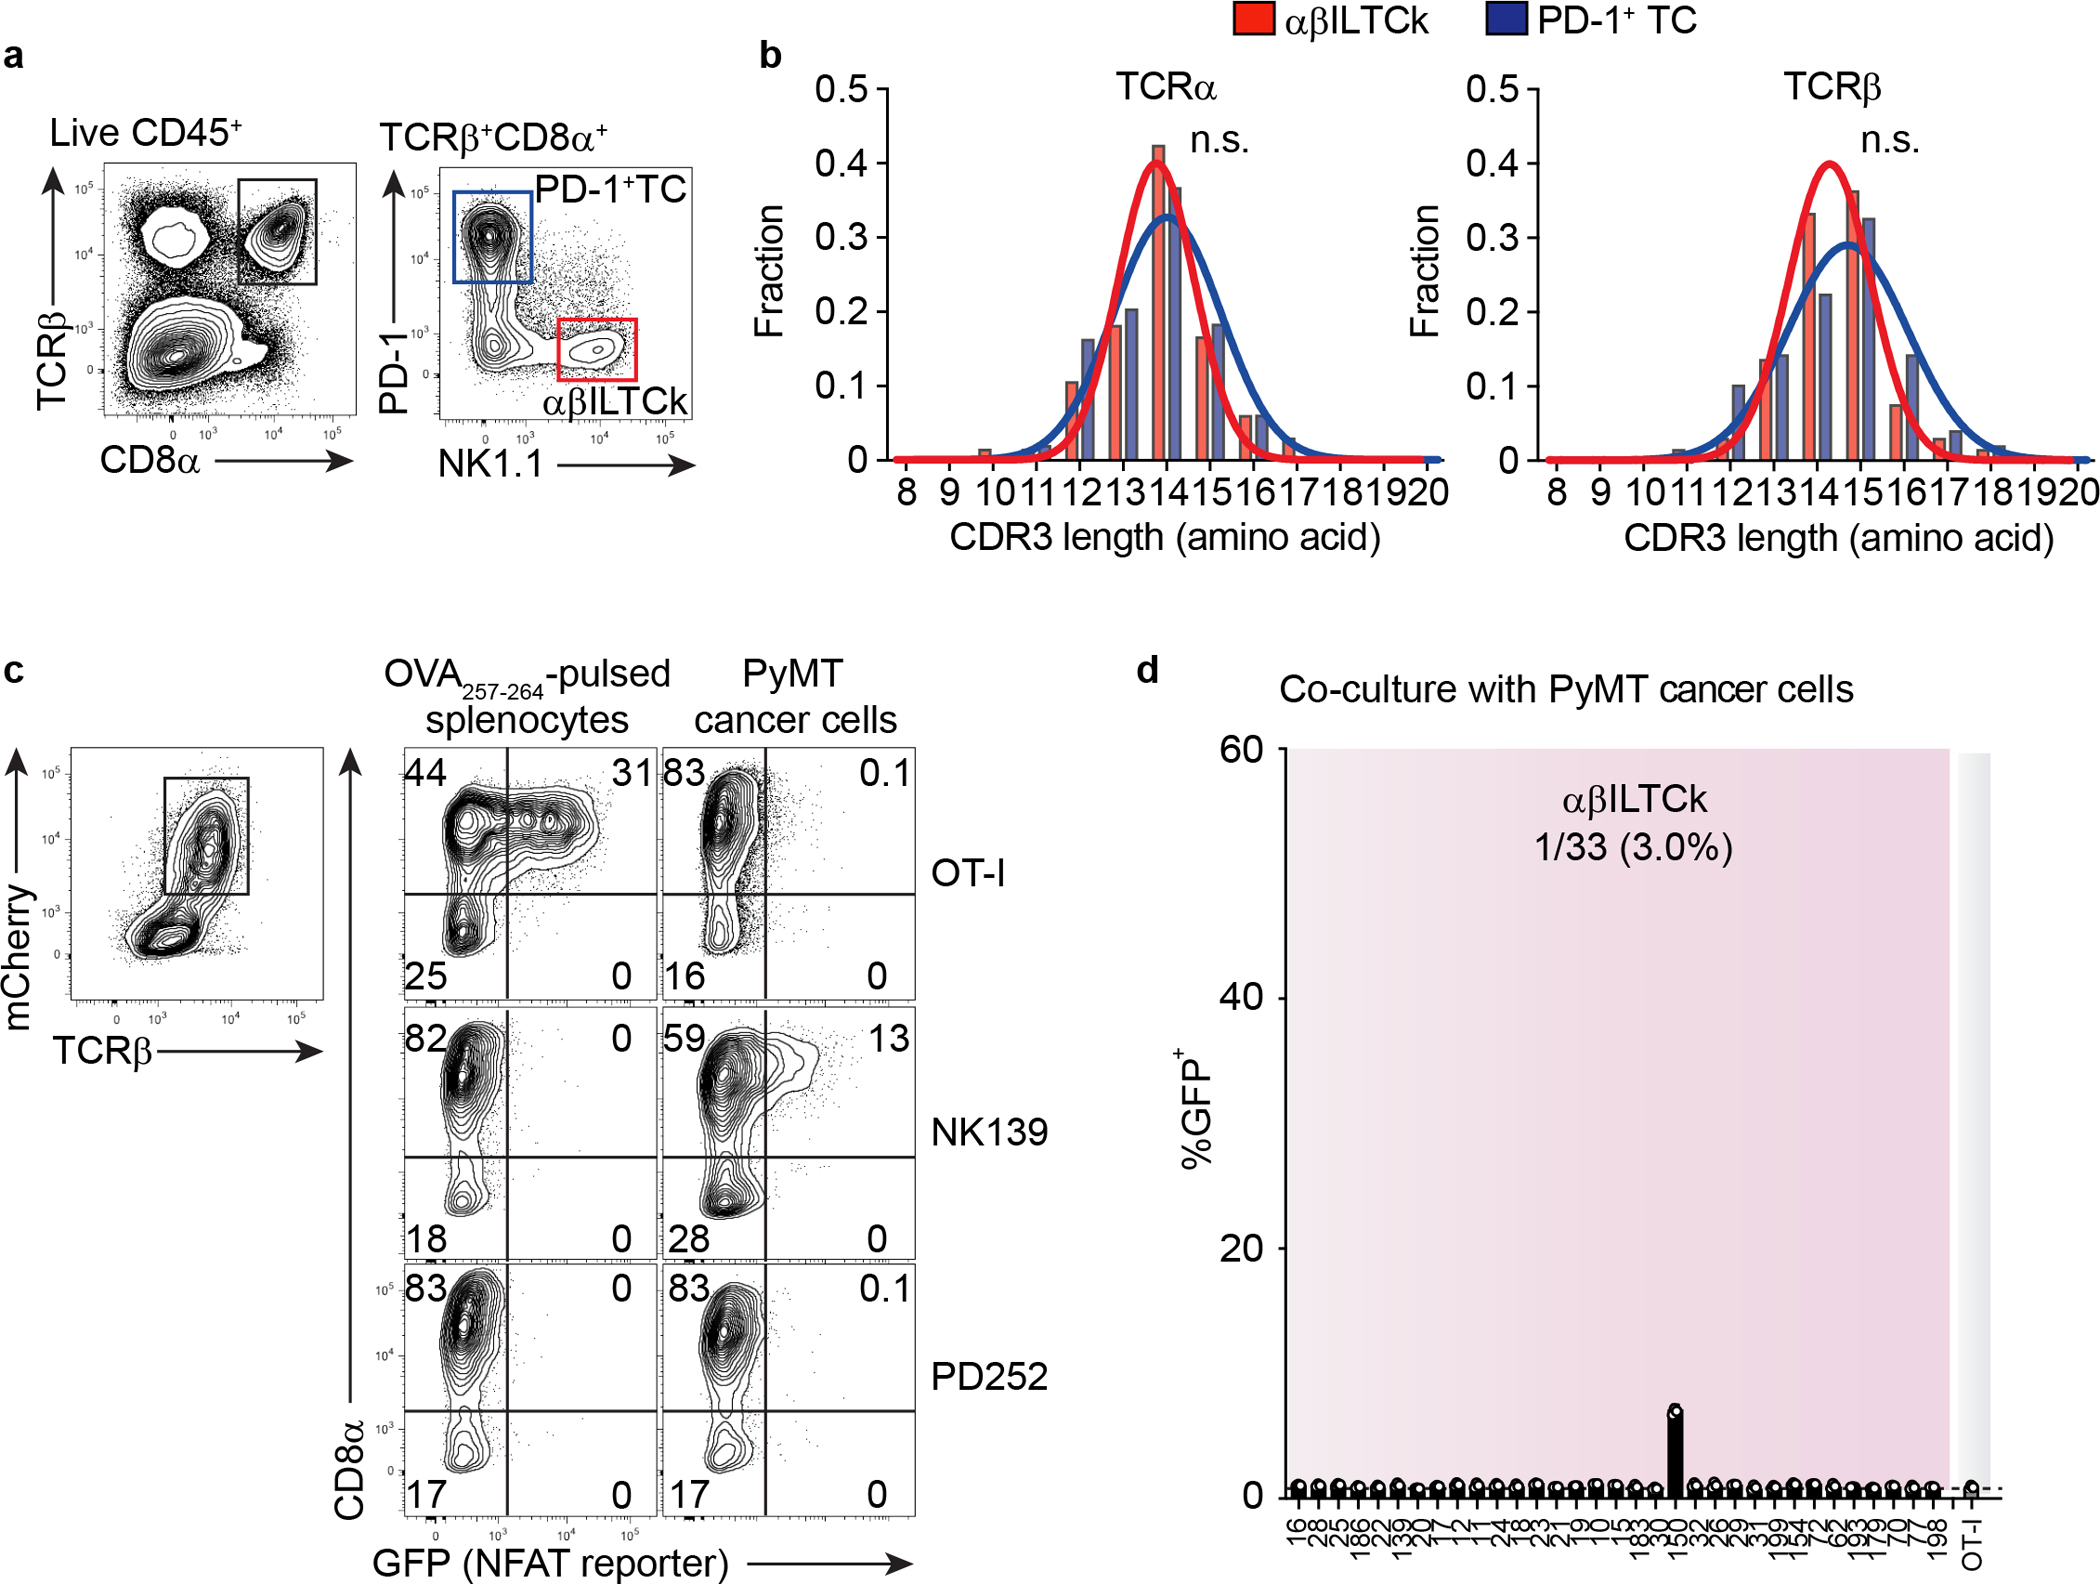
a, A representative flow plot showing the gating strategy used to isolate NK1.1+ αβILTCks and PD-1+ T cells (TCs) from PyMT mice. NK1.1+ αβILTCks are identified as CD45+TCRβ+CD8α+PD-1−NK1.1+ whereas PD-1+ TCs are defined as CD45+TCRβ+CD8α+PD-1+NK1.1−. b, A histogram showing the distribution of CDR3 lengths of TCRα and TCRβ pairs isolated from αβILTCks and PD-1+ TCs. Data are pooled from two independent experiments. c, Flow cytometric analysis showing the frequency of GFP+ cells among CD8+ and CD8− reporter cell line expressing indicated TCRs 24 hours after co-culturing with primary PyMT cancer cells or splenocytes pulsed with the SIINFEKL peptide (OVA257–264). Data are representative of three independent experiments. d, Frequency of GFP+ cells among CD8− reporter cell line expressing indicated NK1.1+ αβILTCk-derived TCRs 24 hours after co-culturing with primary PyMT cancer cells. n = 3 for each TCR. All statistical data are shown as mean ± S.D (biologically independent mice in a-c and independent samples in d).