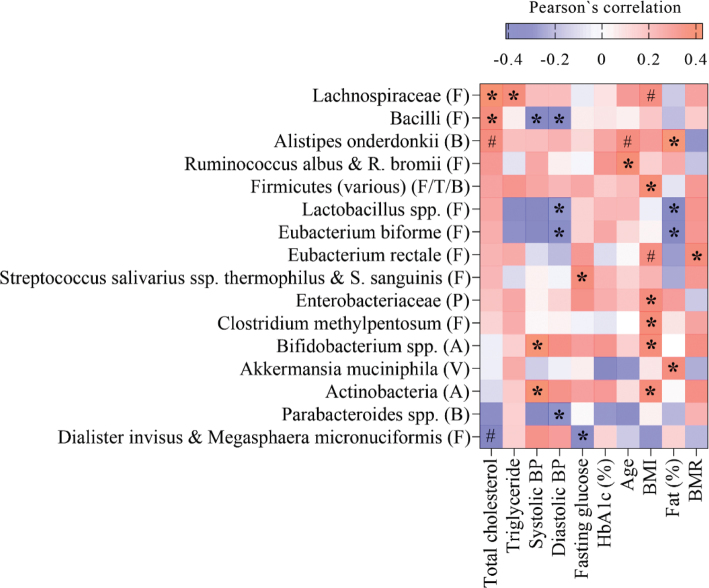
Fig. 2.
Heat map of Parsons’s coefficient between gut bacterial taxa and metabolic and anthropometric markers. The bacterial taxa are sorted from negative (blue) to positive (red) correlation toward total cholesterol levels, assessed by Pearson’s correlation. Significant correlations are marked by * (correlation coefficient ≥ 0.3) or # (correlation coefficient < 0.3). Phylum is indicated within parentheses; A, Actinobacteria; B, Bacteroidetes; F, Firmicutes; P, Proteobacteria; T, Tenericutes; V, Verrucomicrobia; BMI, body mass index; BMR, basal metabolic rate; BP, blood pressure; HbA1c, hemoglobin A1c.

