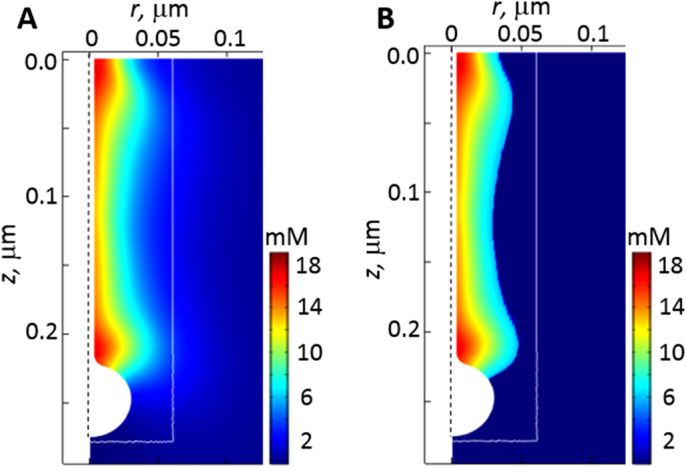
FIGURE 5:

Deriving the number of actin subunits in patches from simulated actin densities. We determined the number of actin subunits in a patch by integrating actin densities within a cylinder outlined in white, which elongates with the invagination (see Figure 2 legend). (A) Snapshot of actin densities (pseudocolors) at the time of peak actin (t = 1.9 s), obtained with optimized parameters for fission yeast (Table 3). (B) Actin densities from A exceeding 6 mM: thresholding eliminates contributions from light-blue subspaces inside the box that may not be detected experimentally. (Vertical dashed lines represent the axis of symmetry of model geometry.)
