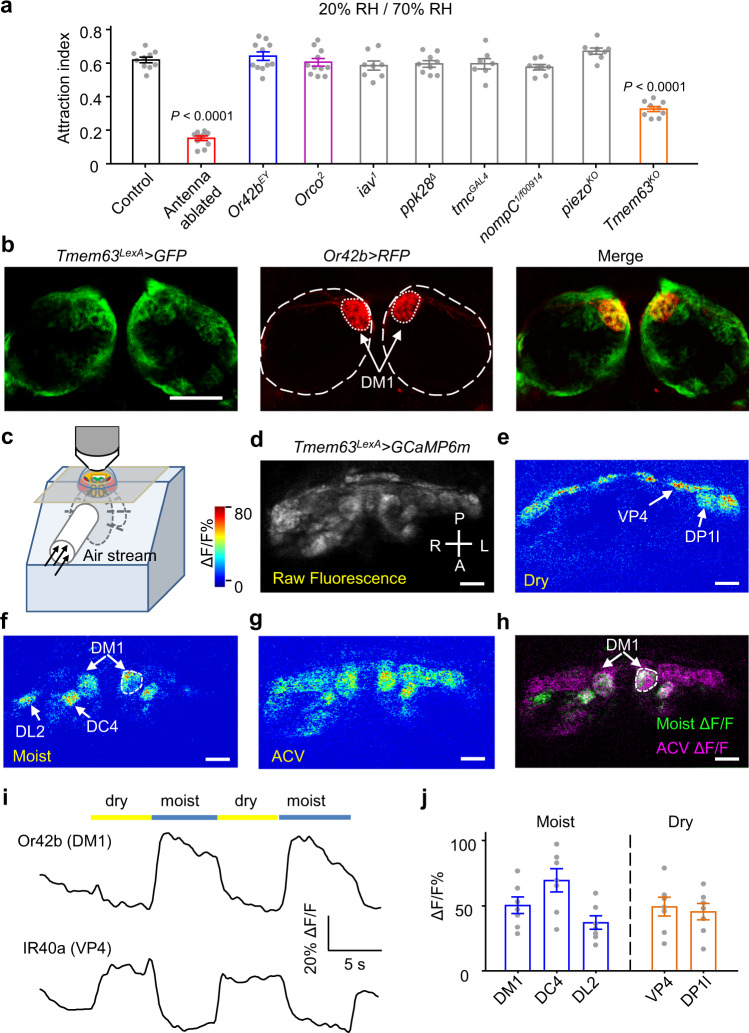
Fig. 3. Identification of humidity sensitive OSNs by using a knock-in driver of Tmem63.
a Plateau attraction indexes for several olfactory receptor and mechanosensitive channel mutants tested in the 20–70% RH condition. n = 10, 10, 11, 11, 8, 9, 7, 8, 8, 9 assays. One-way ANOVA followed by Dunnett’s test for multiple comparison with the control group. b Tmem63 > GFP-labeled and Or42b > RFP-labeled axons project to overlapping regions of the antennal lobe. White dashed lines indicate the border of DM1 glomerulus and antennal lobe. Scale bar, 50 μm. Genotype: UAS-mCD8-RFP,LexAop2-mCD8-GFP; Tmem63LexA/+; Or42b-Gal4/+. Representative images of three biological replicates. c Schematic illustration of in vivo calcium imaging in the antennal lobe. d Raw fluorescence image of Tmem63-expressing axons (in a Tmem63LexA/+; LexAop2-GCaMP6m/+ animal) innervating the antennal lobe. Scale bar, 20 μm. e–g Pseudo color images showing GCaMP6m responses (ΔF/F0) of Tmem63-expressing neurons to humidity stimulations or 1% apple cider vinegar (ACV). Scale bar, 20 μm. h ΔF/F0 response to moist air (green) overlaid on ΔF/F0 response to vinegar (magenta). Scale bar, 20 μm. d–h Representative images from over three independent replicated experiments. i Representative traces for moisture-activated response of DM1 glomerulus (upper) and dry air-activated response of VP4 glomerulus (lower) in different humidity changing cycles. j Peak ΔF/F0 in response to humidity changes. n = 7 flies for each group. Data are mean ± SEM. Source data are provided as a Source Data file.

