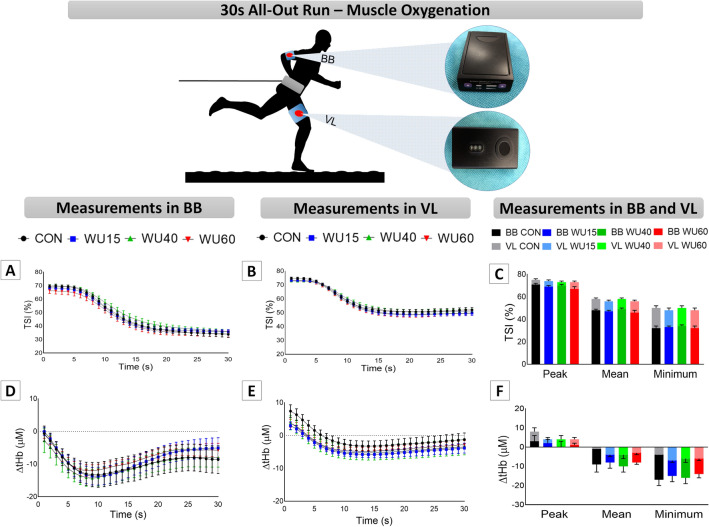
Figure 3.
Results of tissue saturation indexes (TSI, Panels A–C) and total hemoglobin ([tHb], Panels D–F) in biceps brachii (BB) and vastus lateralis (VL) at each second during the 30 s all-out run on a non-motorized treadmill under control conditions (CON, black color) and after the IMW loads with 15% (WU15, blue color), 40% (WU40, green color) and 60% of MIP (WU60, red color), in line graphs. In bar graphs, the dark colors represent the BB, while the light colors correspond to the VL. MIP = maximum inspiratory pressure.

