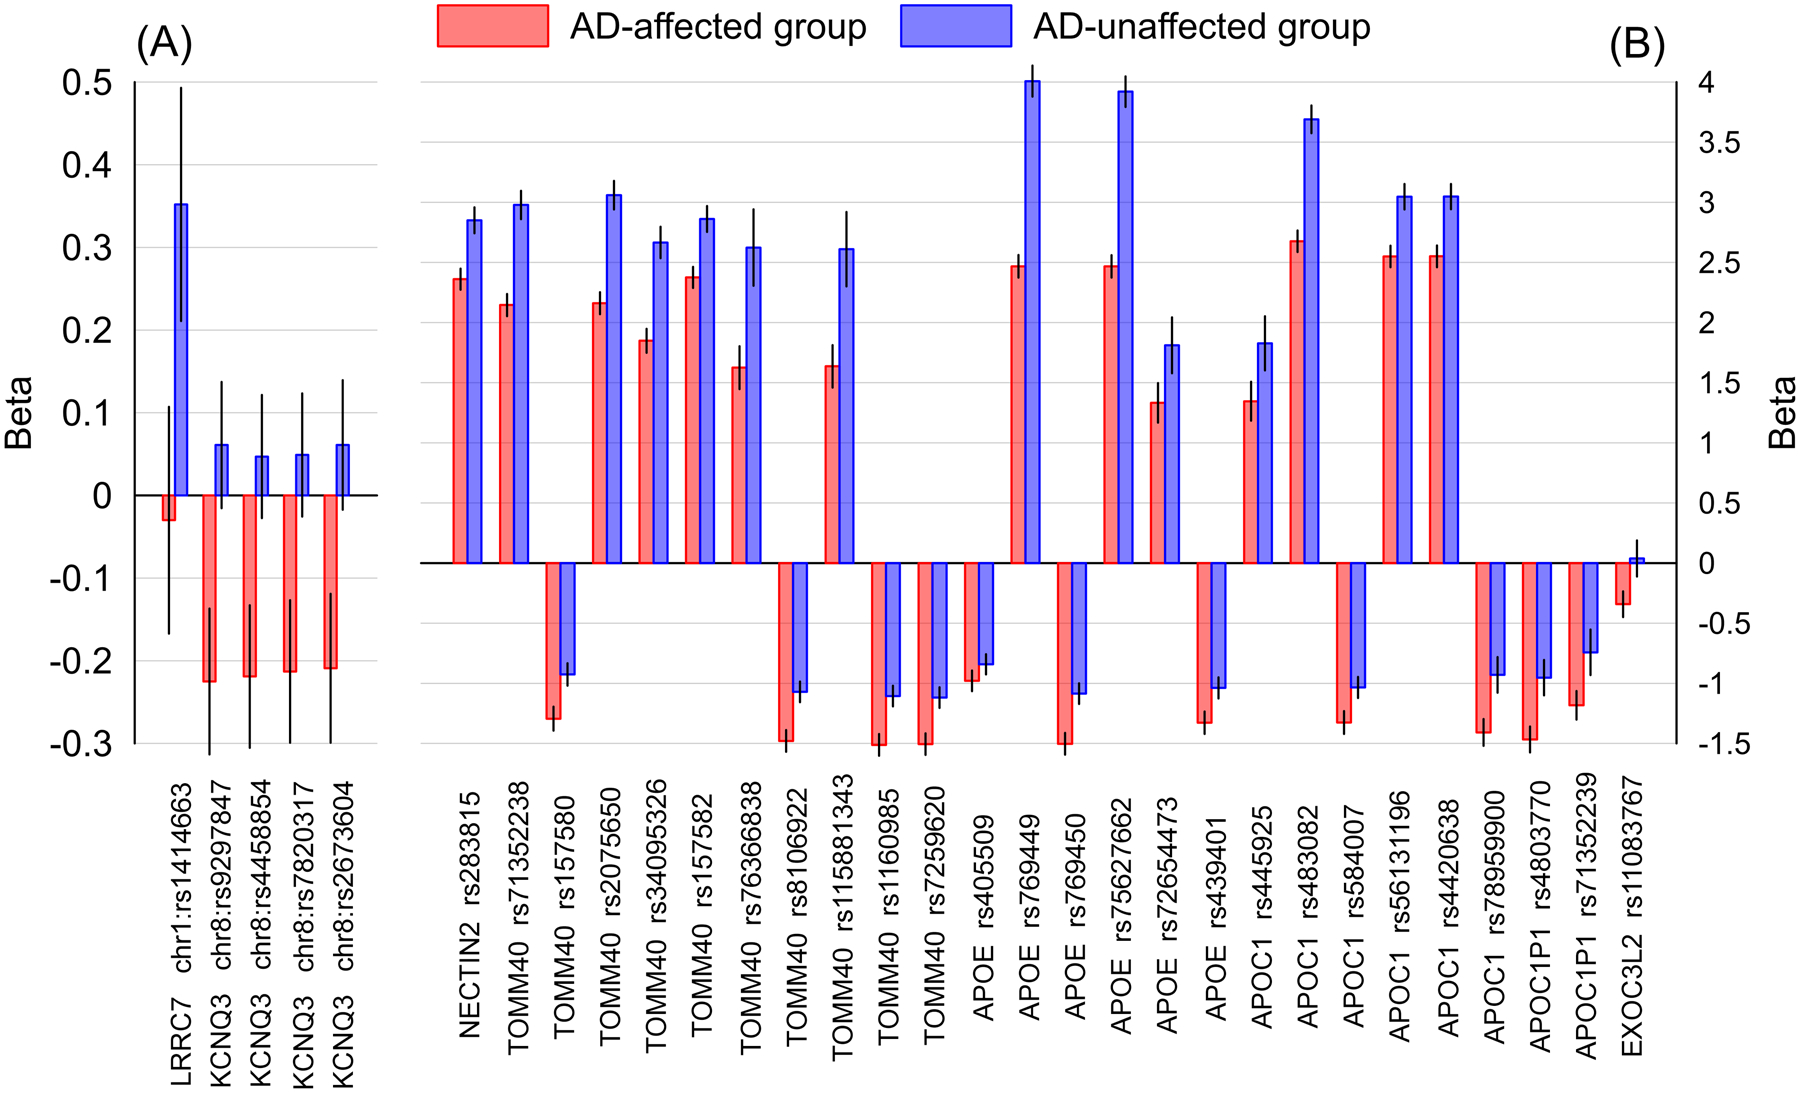
Figure 2.

The effect sizes of the ε4-associated group-specific SNPs in Alzheimer’s disease-affected (AD) and unaffected (NAD) groups. (A) SNPs outside of the APOE 19q13.3 locus and (B) SNPs within the APOE 19q13.3 locus. The x-axis shows SNPs and genes identifiers; the y-axis shows the effect sizes (i.e., beta coefficients), red bars indicate the AD group; blue bars indicate the NAD group. Vertical lines show 95% confidence intervals.
