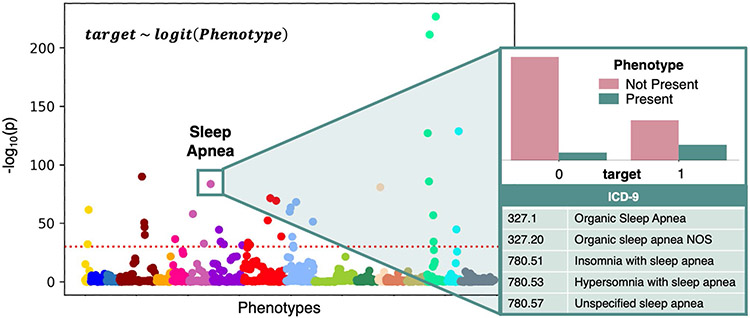
Fig. 1.
Overview of PheDAS. In the background, a Manhattan plot shows the statistical significance of many phenotypes in relation to a single target variable (target). Phenotypes are sorted into and colored by category, and the significance threshold for multiple comparisons correction is marked with a dashed horizontal line. These relationships were estimated by individually modeling the target variable as a function of each phenotype using a logistic regression. For a closer look, the significant phenotype Sleep Apnea is highlighted. The distribution of subjects from each target group that do (not) present the Sleep Apnea phenotype is shown, along with the ICD-9 codes that map to this this phenotype

