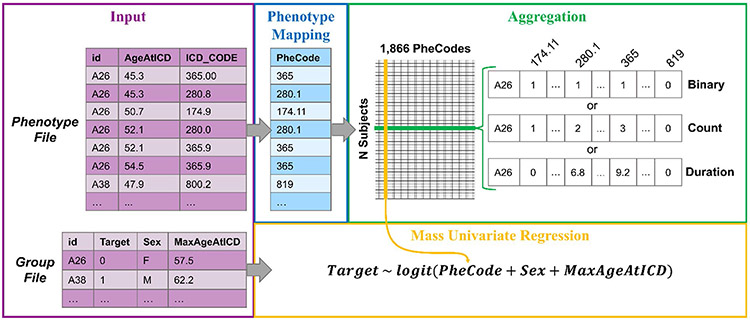
Fig. 4.
Detailed look at phenotype mapping, aggregation, and regression in pyPhewasLookup. On the far left, excerpts from input phenotype and group files containing data from subjects A26 and A38 are shown. ICD codes from the phenotype file are mapped to corresponding PheCodes. These codes are then aggregated via one of three possible methods for each subject; binary, count, and duration aggregations for subject A26 are shown. Finally, the aggregated EMR data is combined with group data (in this case, the target variable Target, and covariates Sex and MaxAgeAtICD), and univariate regressions are computed for each PheCode

