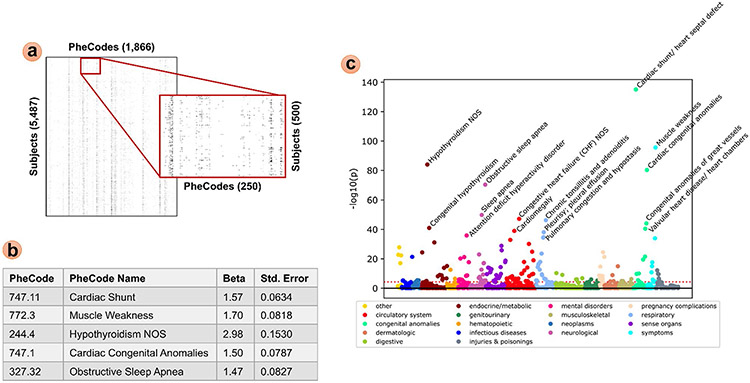
Fig. 6.
Sample PheDAS of ICD records in DS vs. IDD subjects. (a) A binary feature matrix with PheCodes as columns and subjects as rows was constructed from the ICD event records mapped to PheCodes in pyPhewasLookup. (b) Mass univariate logistic regression was performed across PheCodes in the feature matrix using pyPhewasModel; regression results are listed for the top 5 most significant PheCodes (p < < < 0.001 after Bonferroni multiple comparisons correction). (c) Manhattan plot of all results is shown, with the top 14 most significant PheCodes labeled (p < < < 0.001 after Bonferroni multiple comparisons correction). The Bonferroni threshold is shown as a dotted red line

