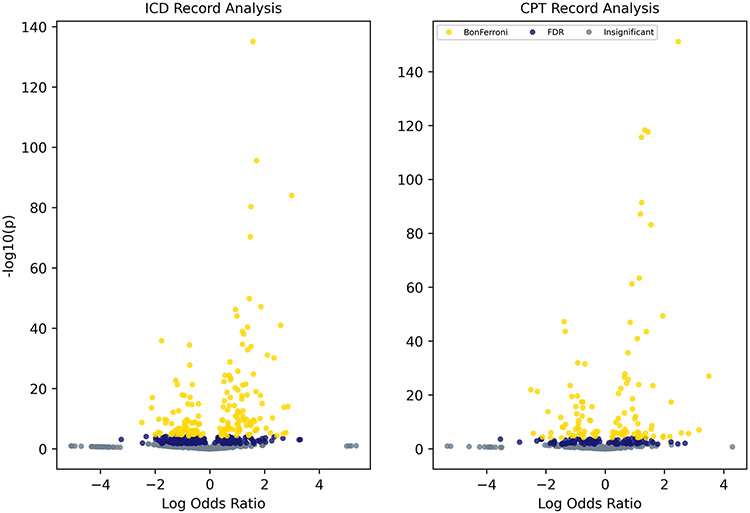
Fig. 8.
Sample volcano plots. Phenotype labels have been removed for legibility. Users may directly interact with these plots via pyPhewas-Plot and pyProwasPlot. Zooming and panning across the plot enable users to explore phenotypes with regard to both significance and effect size. Thresholds for multiple comparisons correction are presented visually via color (Bonferroni in yellow, FDR in dark blue, and no significance in gray)

