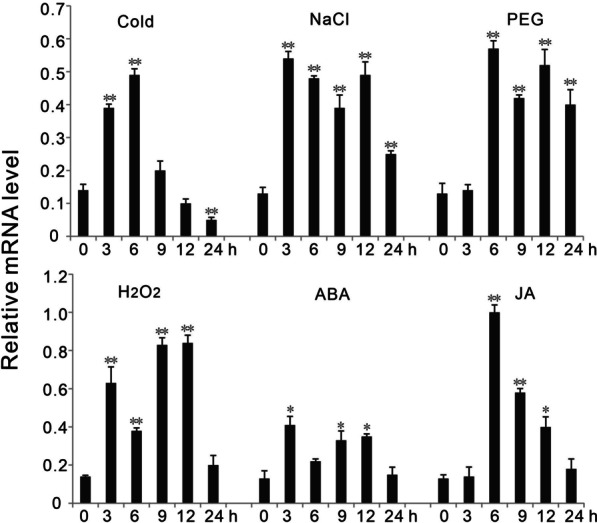
Fig. 1.

The change in expression of OsPP65 in response to various stress and chemical treatments. Cold, 8 ℃; NaCl, 150 mM NaCl; PEG, 20% PEG6000; H2O2, 1% H2O2, ABA, 100 μM ABA; JA, 100 μM JA. Values represent the means ± SD of three biological replicates (5 plants for each replicate), and “Relative expression level” indicates the expression relative to EF1α, which was used as an internal control. The asterisks indicate significant differences compared with the 0 h time point at *P < 0.05 and **P < 0.01 (Dunnett's test)
