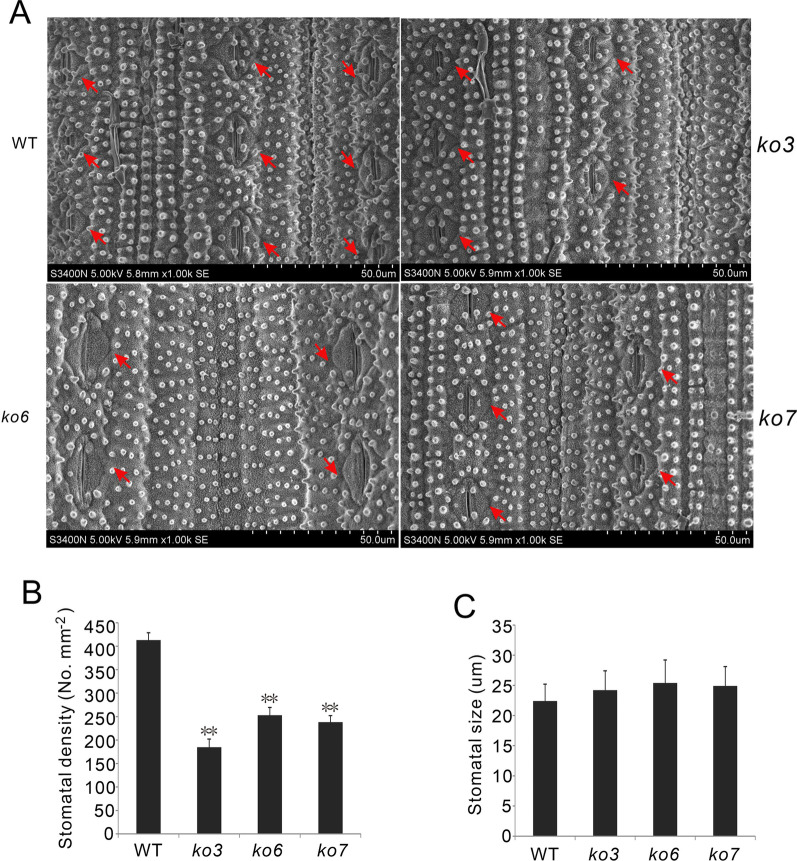
Fig. 4.
Stomatal density and size in the leaves of WT and OsPP65 knockout rice plants. A Photographs showing the stomatal density in WT and OsPP65 knockout plant leaves. Red arrows indicate the stomates in leaves. B Quantification of the stomatal density in leaves of WT and OsPP65 knockout plants. C Quantification of stomatal size in leaves of WT and OsPP65 knockout plants. Data are presented as means ± SD of three biological replicates (5 plants for each replicate) and **P < 0.01 (Dunnett’s test)

