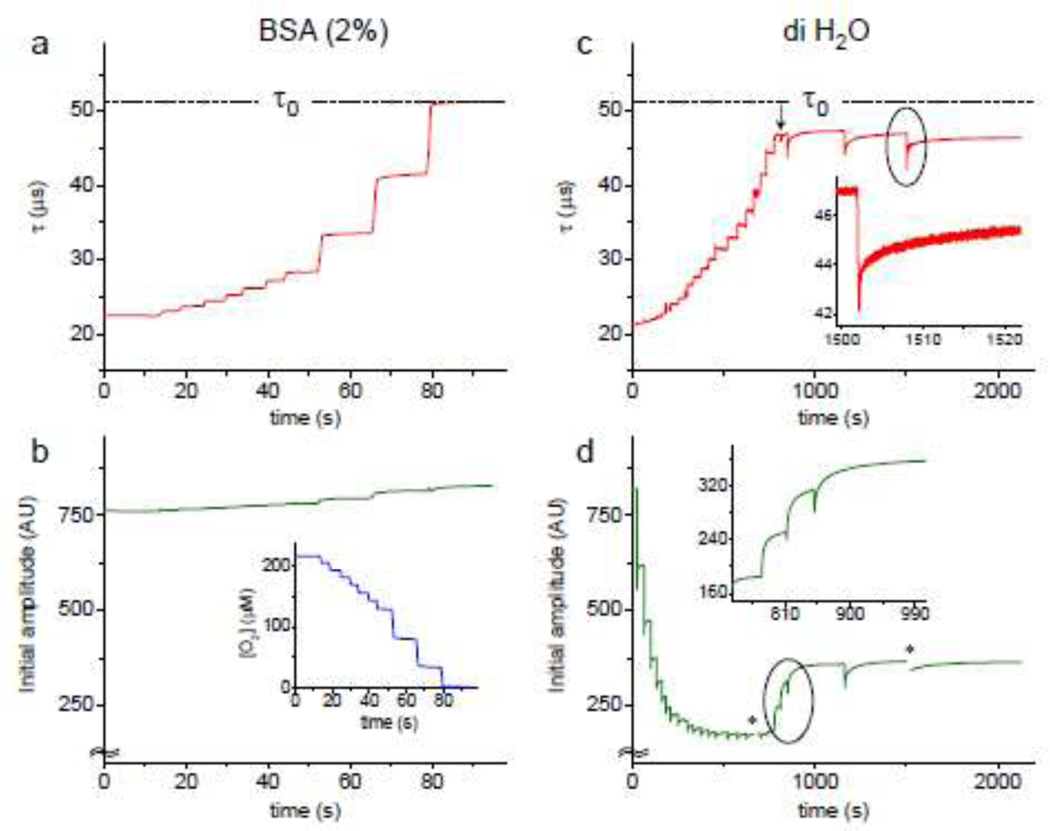
Figure 2.
Changes in the phosphorescence lifetime τ (a and c) and phosphorescence decay initial amplitude (b and d) measured in a buffered solution (20 mM phosphate, pH 7.2) containing BSA (2%) (a, b) and in pure water (c, d) at 22°C. Probe: of Oxyphor PtG4 (1 μM). The solutions were subjected to irradiation by proton FLASH: for (a, b) - 7 exposures of 30 Gy, then 3 exposures of 100 Gy; for (c, d) - all exposures were 30 Gy. In all cases, the dose rate was ~105 Gy/s. Inset in (b): [O2]-trace derived from the τ-trace shown in (a). Insets in (c) and (d): expanded sections of the traces encircled in the main graphs. Asterisks in (d) mark the regions corresponding to high-speed recordings, where the determination of the initial amplitudes was obscured by noise.

