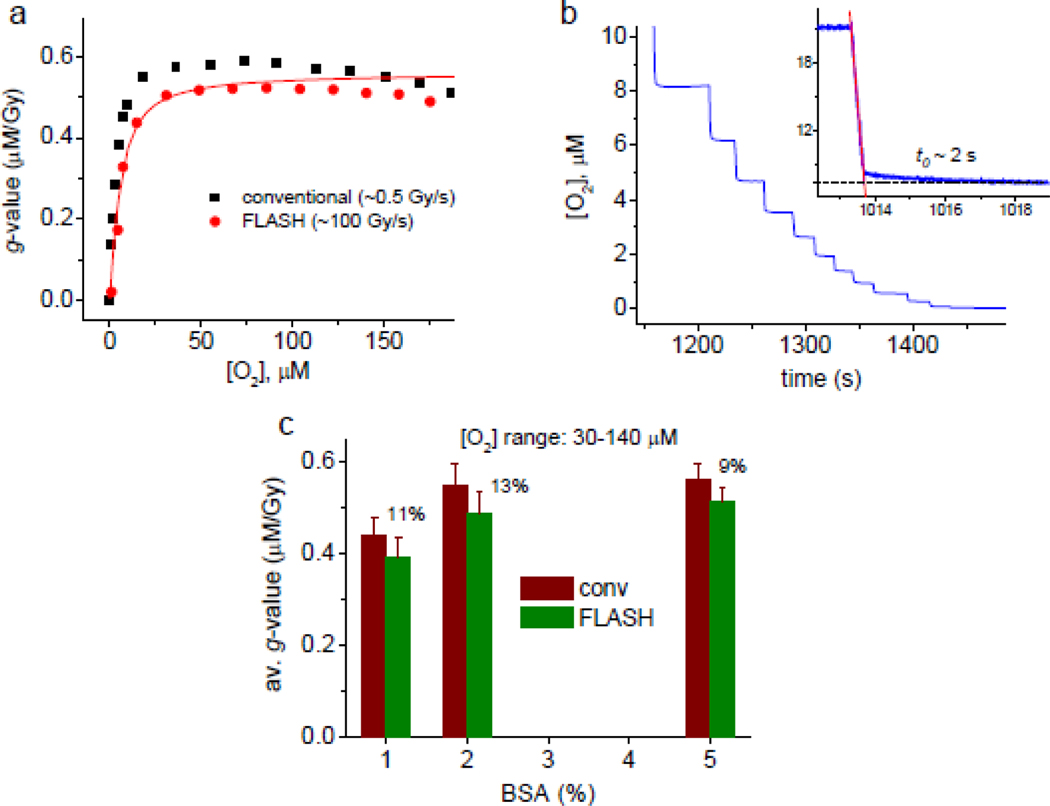
Figure 3.
(a) Oxygen depletion g-values (μM/Gy) for conventional and FLASH dose rates (black and red symbols, respectively), in buffered aqueous solutions (5% BSA, 20 mM phosphate, pH 7.2) measured using Oxyphor PtG4. The solid line represents a simulated g-value dependence (see text and SI for details). (b) The tail of the oxygen depletion trace for FLASH dose rate (105–109 Gy/s, 10 Gy per FLASH). Measurements using Oxyphor PtG4 and PdG4 produced similar results. Experiments with Oxyphor PdG4 are shown. Inset: depletion of oxygen upon application of FLASH (30 Gy, 100 Gy/s) is followed by a slow decay phase (time constant t0~2 s). (c) g-Values in the range of 30–140 μM for BSA solutions of different concentrations (1%, 2% and 5%).

