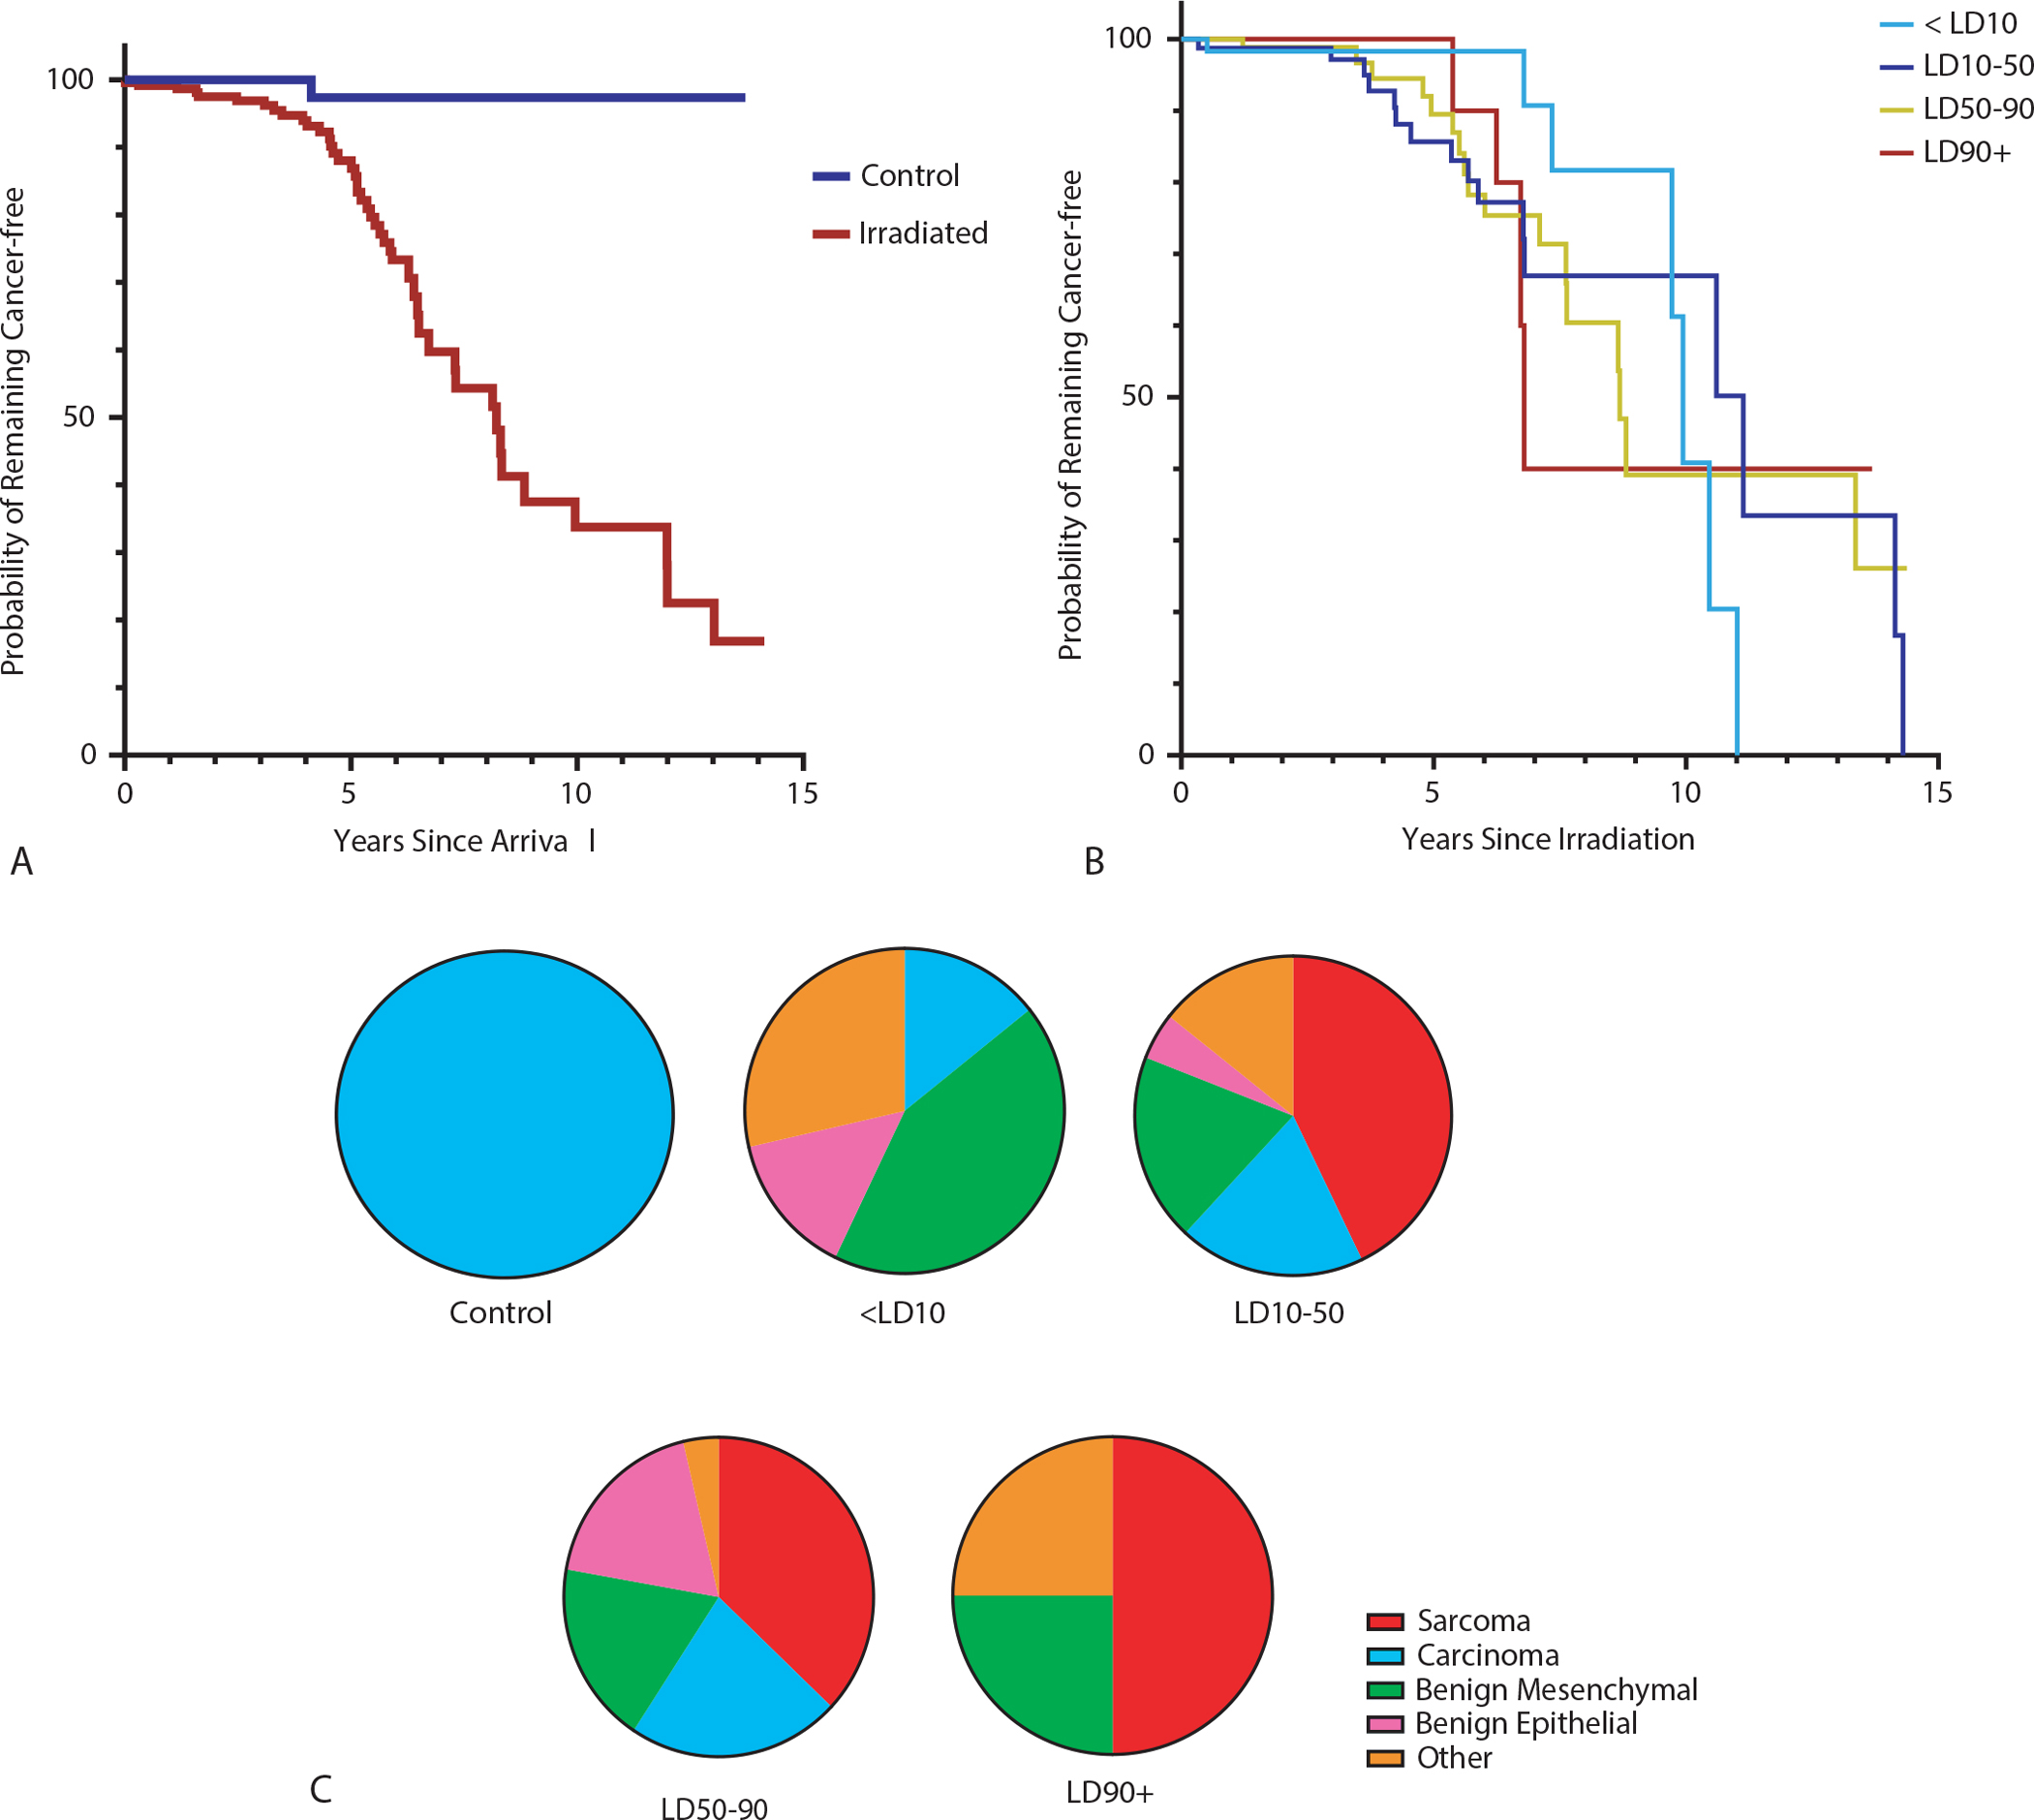
Fig. 2.

Radiation and neoplasia incidence. (A) Kaplan-Meier plot showing probability of remaining tumor-free in irradiated monkeys compared to nonirradiated controls. The time interval (x-axis) is set from the age at arrival to the age at neoplasia diagnosis or current age. There is a marked difference between the groups, with irradiated animals less likely to remain tumor-free with time (log rank test P < .0001). (B) Kaplan-Meier plot demonstrating probability of remaining cancer free in each radiation lethality dose (LD) group. There is no significant difference between dose groups (log rank test P = .28). The time interval (x-axis) is set from the age at irradiation to the age at diagnosis. (C) Proportions of earliest-diagnosed neoplasm types within each lethality dose group.
