
Figure 6. Secreted CXCL14 promotes an anti-tumor CD8+ T cell response in vivo.
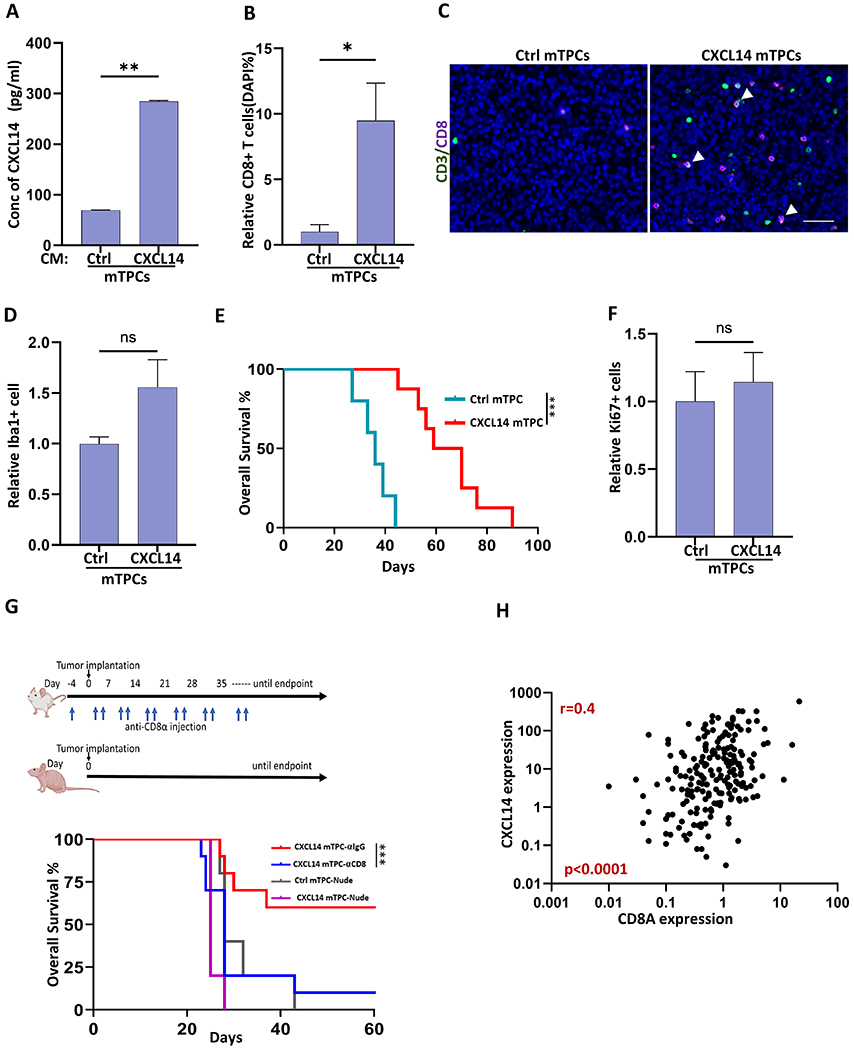
(A) Secreted CXCL14 in cell-free conditioned media (CM) from murine tumor progenitor cells (mTPCs) expressing CXCL14 (CXCL14) or GFP-control (Ctrl). (B) Quantification of CD8+ T cells as percentage of total cells in CXCL14 (n=8 mice) and Ctrl tumors (n=5 mice). (C) Representative images demonstrating CD3+ (green), CD8+ (violet), and dual CD3+CD8+ (white,arrow) T cells in CXCL14 and Ctrl tumors. (D) Quantification of Iba1+ tumor-associated microglia/macrophages per tumor area in CXCL14 (n=7 mice) relative to Ctrl tumors (n=4 mice). (E) Kaplan-Meier survival analysis. Mice with intracerebral allograft of CXCL14 mTPC have prolonged survival (median survival of 64.8 days) relative to Ctrl mTPC (median survival of 35.8 days) (p<0.003, n=8 and n=5, respectively) (F) Quantification of proliferating cells as denoted by Ki-67 per tumor area in CXCL14 (n=7 mice) relative to Ctrl tumors (n=4 mice). (G) Schema for tumor implantation in nude mice (n=5 per group) and FVB mice (n =10 per group) with biweekly anti-CD8α treatment to deplete CD8+ T cells (blue arrows). Corresponding isotype antibody used as control. Nude mice were implanted with either CXCL14 mTPC or Ctrl mTPC and FVB mice were implanted with CXCL14 mTPC. Kaplan-Meier survival analysis (below).(H) Correlation between CXCL14 gene expression and CD8A gene expression in pediatric astrocytoma (CBTN; Spearman’s correlation coefficient, r=0.45, n=202, p<0.0001). Bar graphs represent Mean+SEM. Significance were obtained using Student’s t test. *p<0.05, **p < 0.01, ****p < 0.0001 and ns indicates p > 0.05. Scale bar: 100 μm. Figure 6G (top FVB and nude mouse) was created with BioRender.com.