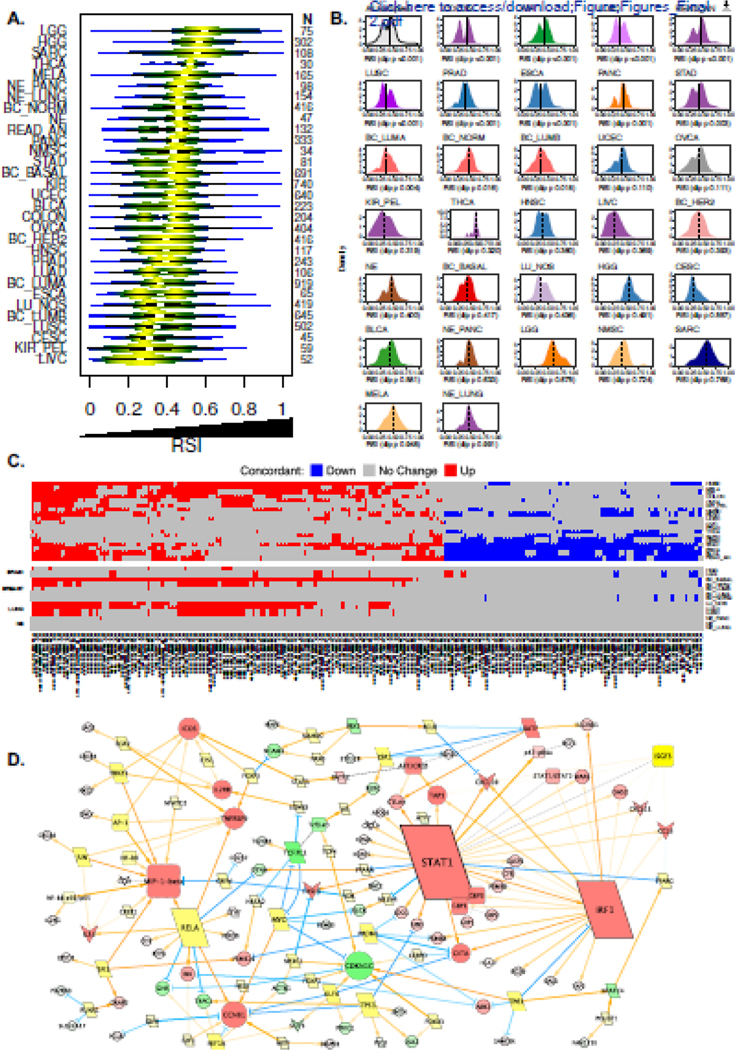
Figure 2. Characterization of tumor radiosensitivity and coordinated biology estimated by the RSI.
(a) Violin plots depicting distribution of RSI values across 10,469 primary tumor samples representing 31 tumor types. (b) Hartigan’s dip statistic across 31 tumor types to evaluate for unimodal distributions of RSI. Analysis demonstrates that several tumor types do not have a unimodal distribution of RSI values, which suggests biologic heterogeneity. Dashed line on each density plot represents the tumor type-specific median RSI value. (c) Heatmap of differentially expressed probesets (n=209, representing 146 unique genes) between radiosensitive (RSIlo) and radioresistant (RSIhi) tumors across six or more of the 31 tumor types, which are concordant in direction of expression (up, red; down, blue; no change, gray). See Supplemental Table 5 for list of probesets. (d) Differentially expressed probesets (146 genes) from Figure 2c were used as seeds for network generation (see Methods). Genes upregulated (red), downregulated (green) in RSIlo versus RSIhi tumors are depicted; node size indicates degree of edges. Yellow nodes indicate bridging genes.

