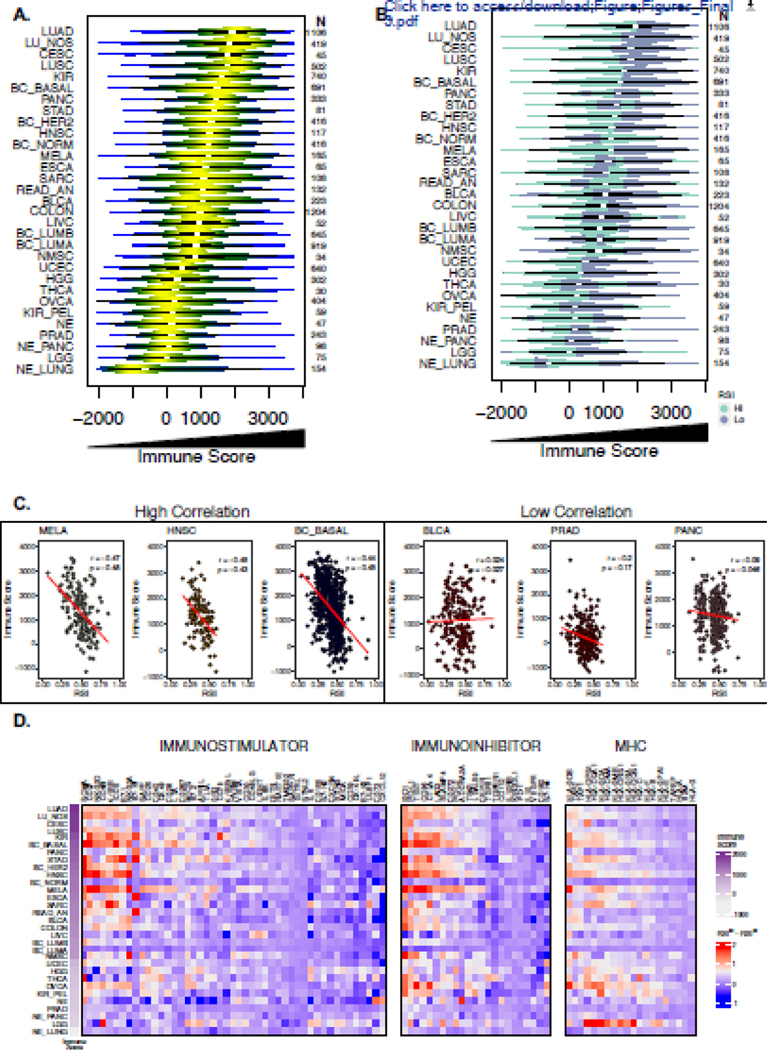
Figure 3. Evaluation of the association between immune cell infiltration, regulators of immune escape and the RSI.
(a) Violin plots depicting distribution of ESTIMATE-derived immune score values across 10,469 primary tumor samples representing 31 tumor types. (b) Integration of RSI and the immune score where radiosensitive (RSIlo; blue-green) radioresistant (RSIhi; purple) categorization is determined by the median RSI value within each tumor type. (c) Scatter plots of the RSI and immune score among high correlated and low correlated tumor types with Pearson’s correlation coefficient and Spearman’s ρ shown. (d) Heatmap of log2 gene expression differences of markers of immune escape between RSIlo and RSIhi tumors. Markers are categorized as defined by Charoentong et al. into immunostimulators, immunosuppressors and MHCs (class I, class II, non-classical) and genes were clustered within groups and row ordered (tumor type) from decreasing median immune score.

