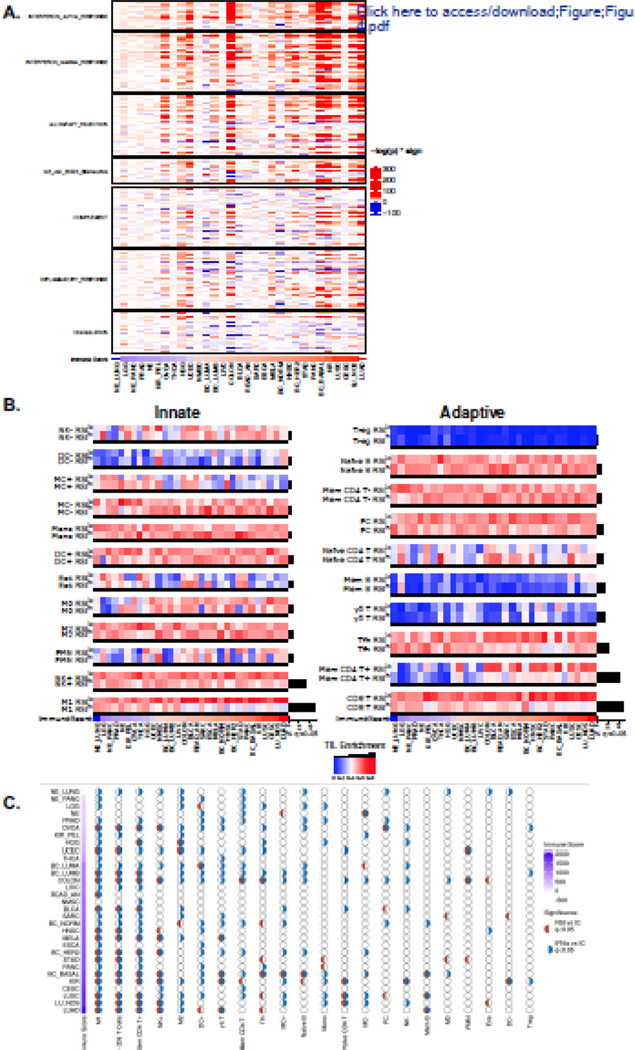
Figure 4. The RSI describes distinct tumor immune microenvironments.
(a) RSIlo versus RSIhi tumors were compared with single sample gene set enrichment analysis (ssGSEA) using the MSigDB hallmark pathway genes related to immune signaling. Heatmap intensity depicts the -log p-value of the Fisher exact test multiplied by the directionality of expression difference; enriched in RSIlo (red) or RSIhi (blue). Tumor types are ordered by the immune score. (b) Tumor types are ordered by immune score and normalized CIBERSORT immune cell infiltrate estimates are compared within a given tumor type by dichotomizing at the median RSI value to identify RSIlo and RSIhi tumors. Immune cell infiltrates involved in the innate (left panel) and the adaptive (right panel) response. Hypothesis tests (Fisher’s exact test) in tumor types between RSIhi and RSIlo were performed; a black bar beneath the comparison denotes false-discovery rate adjusted q < 0.05. Black bars to the right of heatmap indicate proportion of significant tumor types for given immune cell infiltrate enrichment comparison between RSIlo and RSIhi tumors. (d) Associations of IFNα and the RSI with immune cell (IC) subtypes as independent or coordinated biology. Half-circles represent whether comparison within a tumor type and IC subtype are significant (q < 0.05); red (RSI vs IC), blue (IFNα vs IC). Empty circles imply no association between variables. Tumor types are ordered by immune score.

