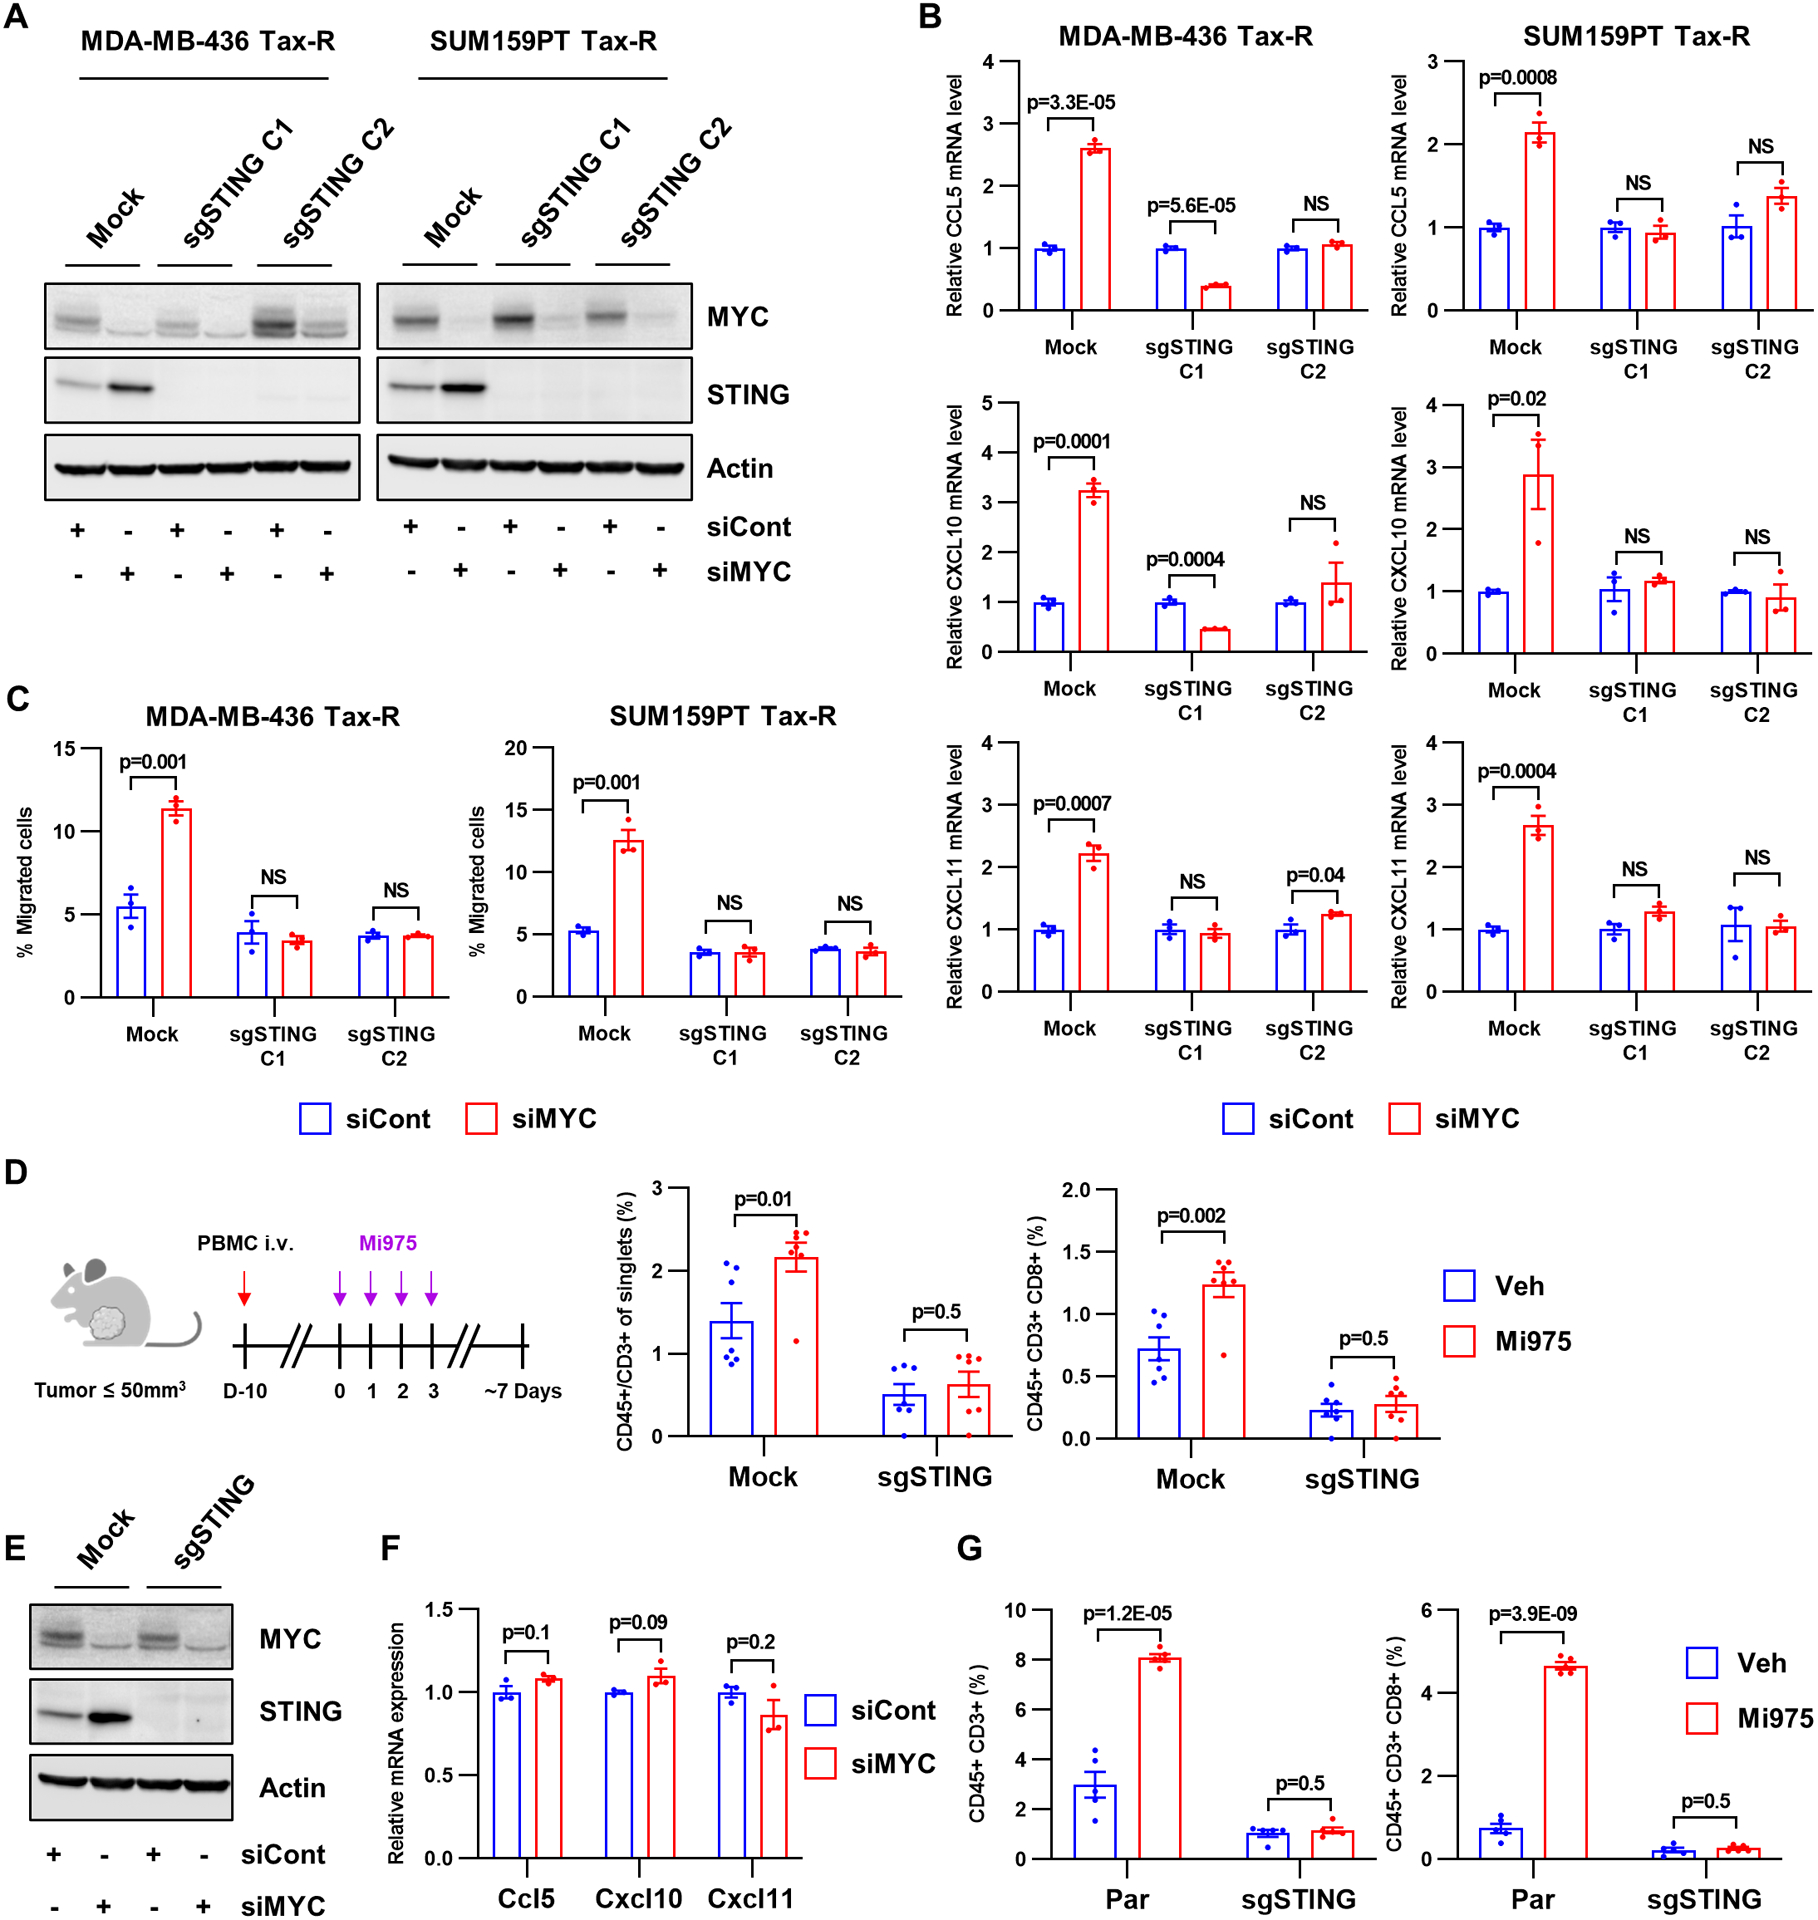
Figure 5. T cell–inflamed TME driven by MYC inhibition is mediated by STING.

A, Immunoblot analysis for MYC, STING and actin in MDA-MB-436 and SUM159PT Tax-R STING1 KO cells transfected with MYC siRNA or control siRNA. B, RNA was extracted from cells shown in A and subjected to RT-qPCR. Bars represent the mean ± SEM (n=3; two-tailed unpaired t-tests). C, Transwell migration of Jurkat CXCR3 cells. Conditioned media from cells shown in A was added to the bottom wells. Each bar represents the mean ± SEM (n=3; two-tailed unpaired t-tests). D, Flow cytometry quantification of tumor-infiltrating lymphocytes isolated from PBMC-humanized mice bearing established SUM159PT Tax-R or Tax-R STING1 KO tumors treated with vehicle or MYCi975. Bars represent the mean ± SEM (n=5; two-tailed unpaired t-tests). E, 4T1 Sting1 KO cells were transfected with MYC siRNA or control siRNA for 48 h. Cell lysates were prepared and subjected to immunoblot analysis with MYC, STING and actin antibodies. F, RNA was extracted from cells shown in E and subjected to RT-qPCR. Bars represent the mean ± SEM of mRNA relative to cells transfected with control siRNA (n=3; two-tailed unpaired t-tests). G, Flow cytometry quantification of tumor-infiltrating lymphocytes isolated from BALB/c female mice bearing 4T1 parental and Sting1 KO tumors treated with vehicle or MYCi975. Each bar represents the mean ± SEM (n=5; two-tailed unpaired t-tests).
