. 2022 May 6;28(13):2854–2864. doi: 10.1158/1078-0432.CCR-21-3695

Figure 5.

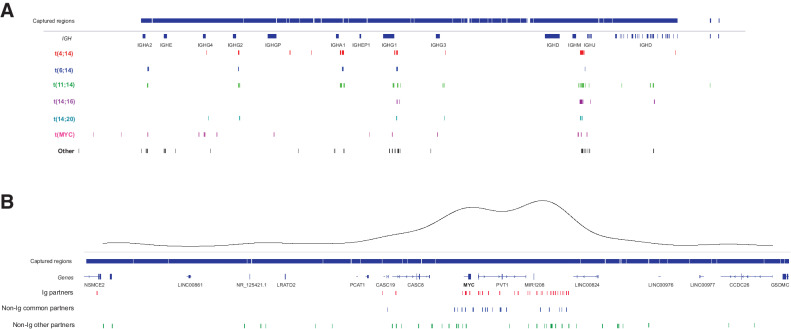
Figure 5. Translocation breakpoints. A, IGH@ locus breakpoints broken down by partner chromosome. V regions not shown for clarity. Captured regions extend to each V region. B, MYC region breakpoints broken down by Ig, non-Ig common (FOXO3, TXNDC5, FAM46C), and other partners. A kernel density plot shows the two main translocation hotspots centromeric of MYC and telomeric of PVT1.

Translocation breakpoints. A,IGH@ locus breakpoints broken down by partner chromosome. V regions not shown for clarity. Captured regions extend to each V region. B,MYC region breakpoints broken down by Ig, non-Ig common (FOXO3, TXNDC5, FAM46C), and other partners. A kernel density plot shows the two main translocation hotspots centromeric of MYC and telomeric of PVT1.