
Figure 2:
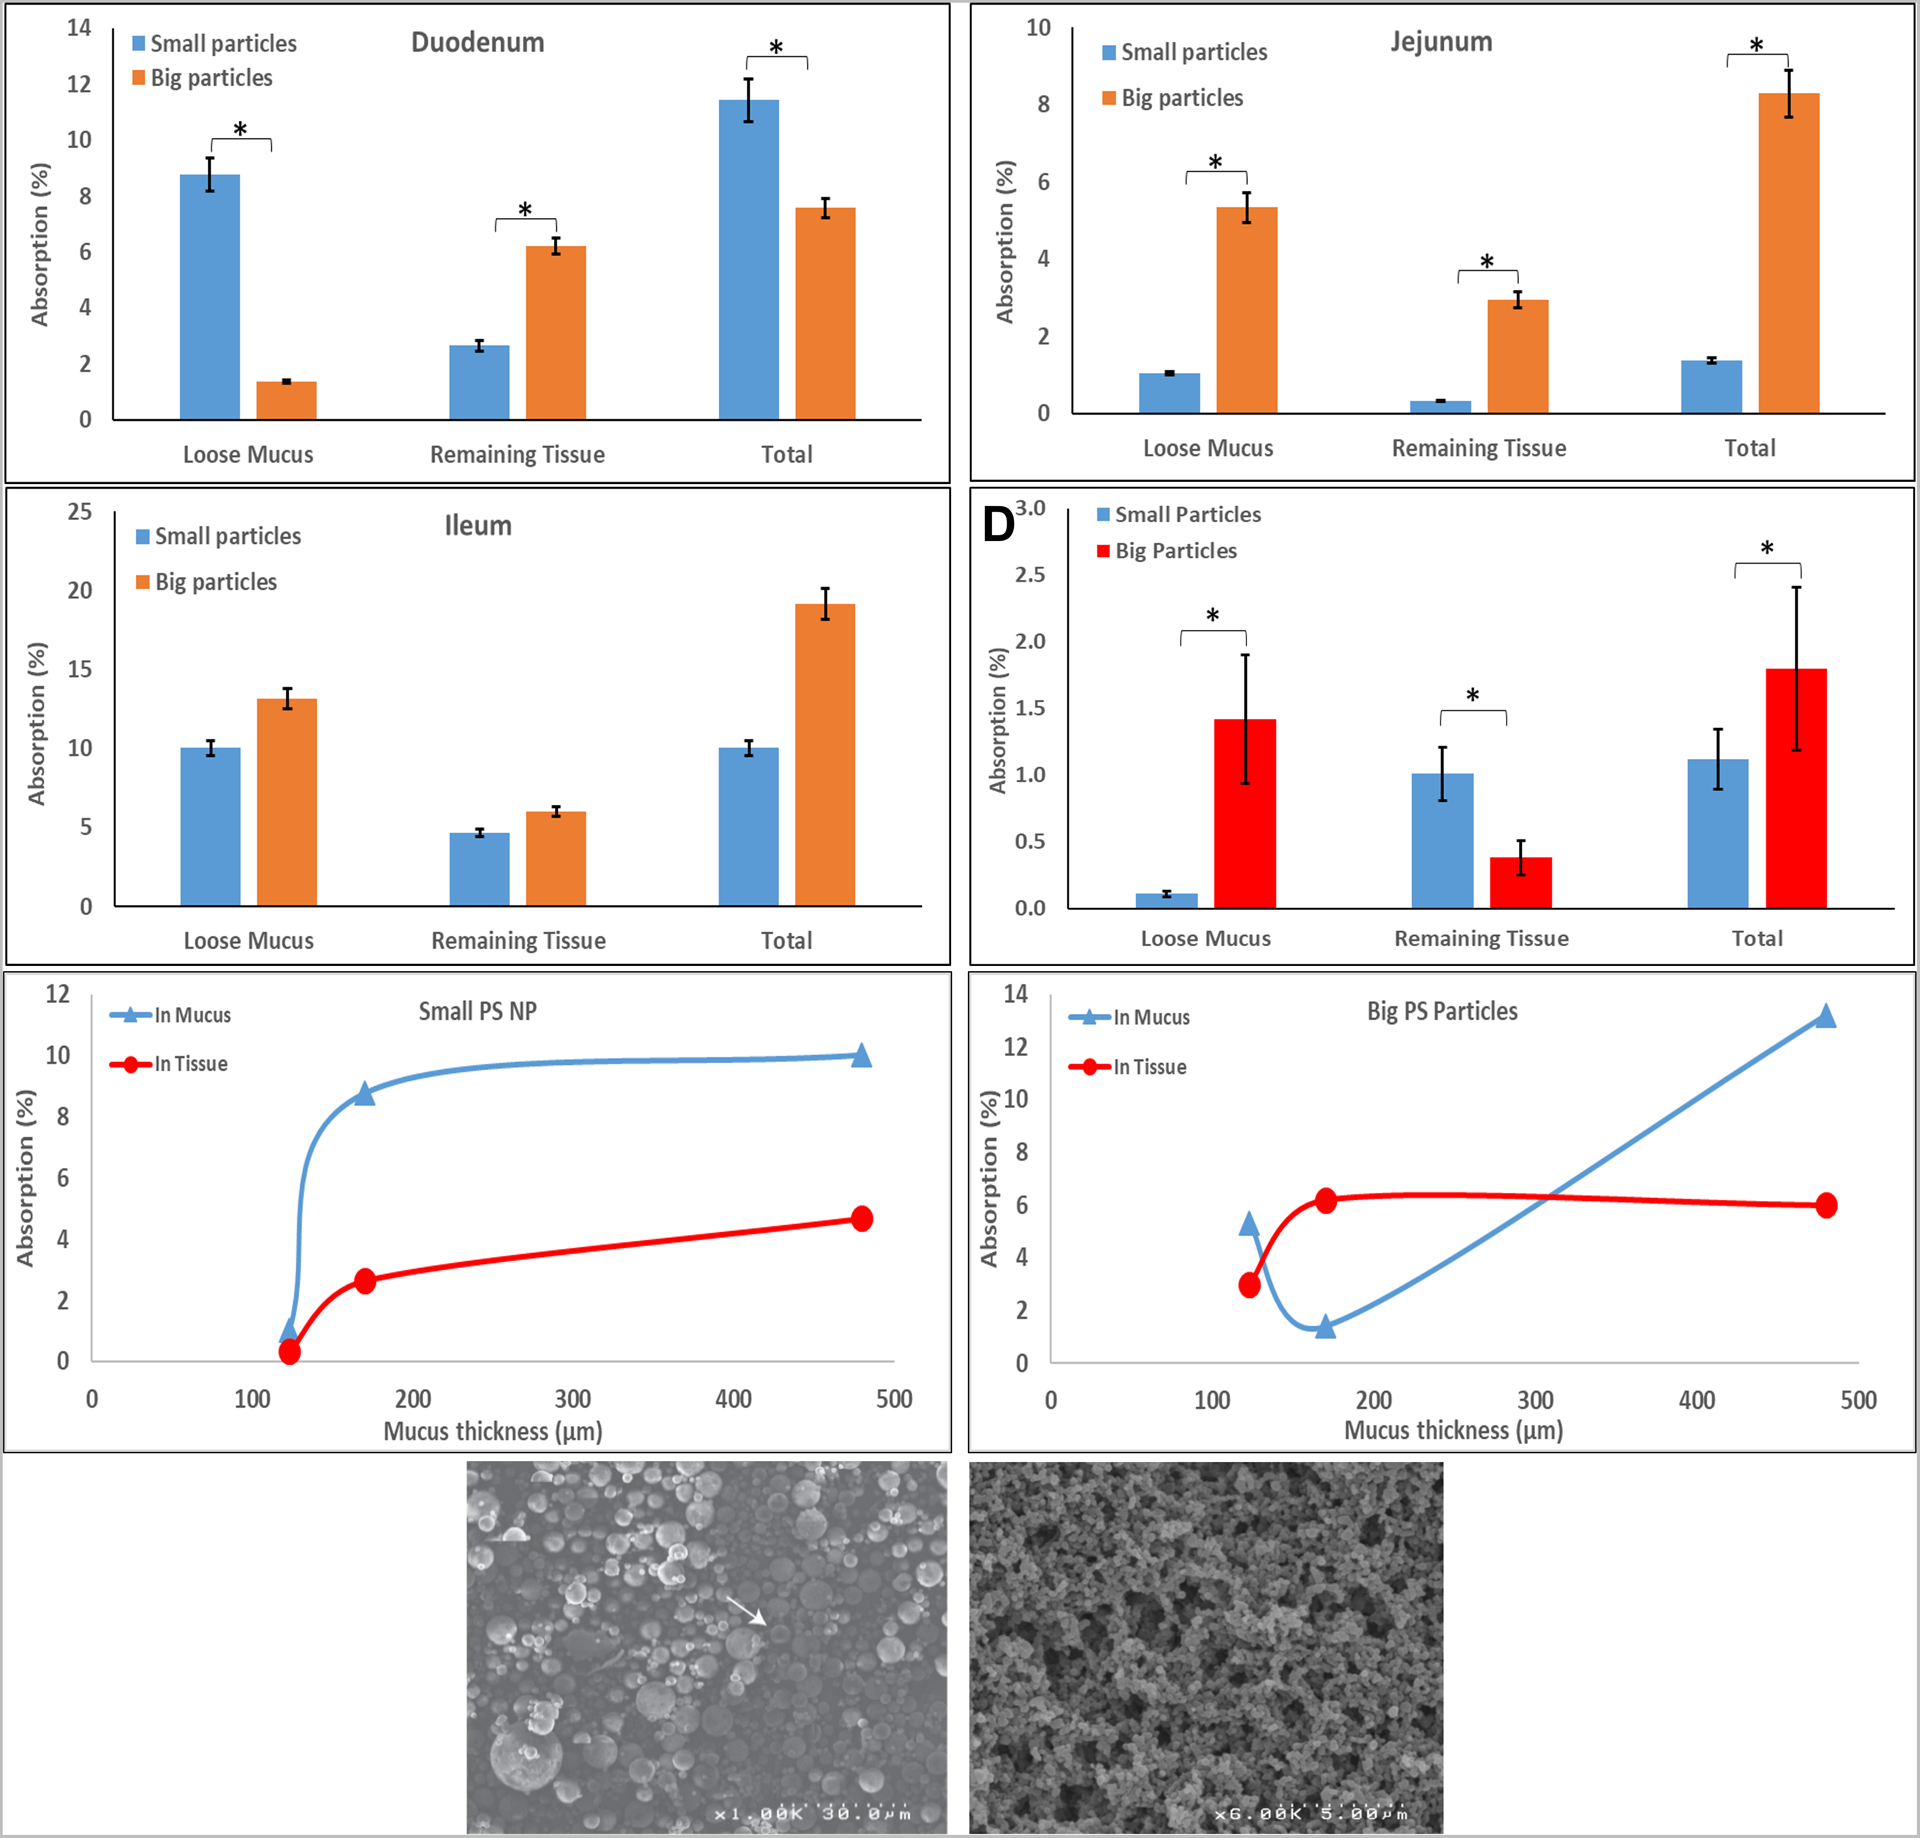
‘Big’ and ‘small’ PS NPs penetration into GI segments and the respective mucus of rats post 1h exposure in vitro; (A-C) Duodenum, Jejunum, and Ileum, respectively; (D) in vivo penetration into jejunum and mucus of rats post 5h exposure. ‘Small’ (E) and ‘big’ (F) PS NPs entrapment post 1h ex vivo in mucous (triangles) and its underlying tissue (circles) vs. mucous thickness. G-H SEM micrographs of ‘big’ and ‘small’ PS NPs, respectively. Values represent means (n≥3) ± SD (* p value<0.05).