
Fig. 1.
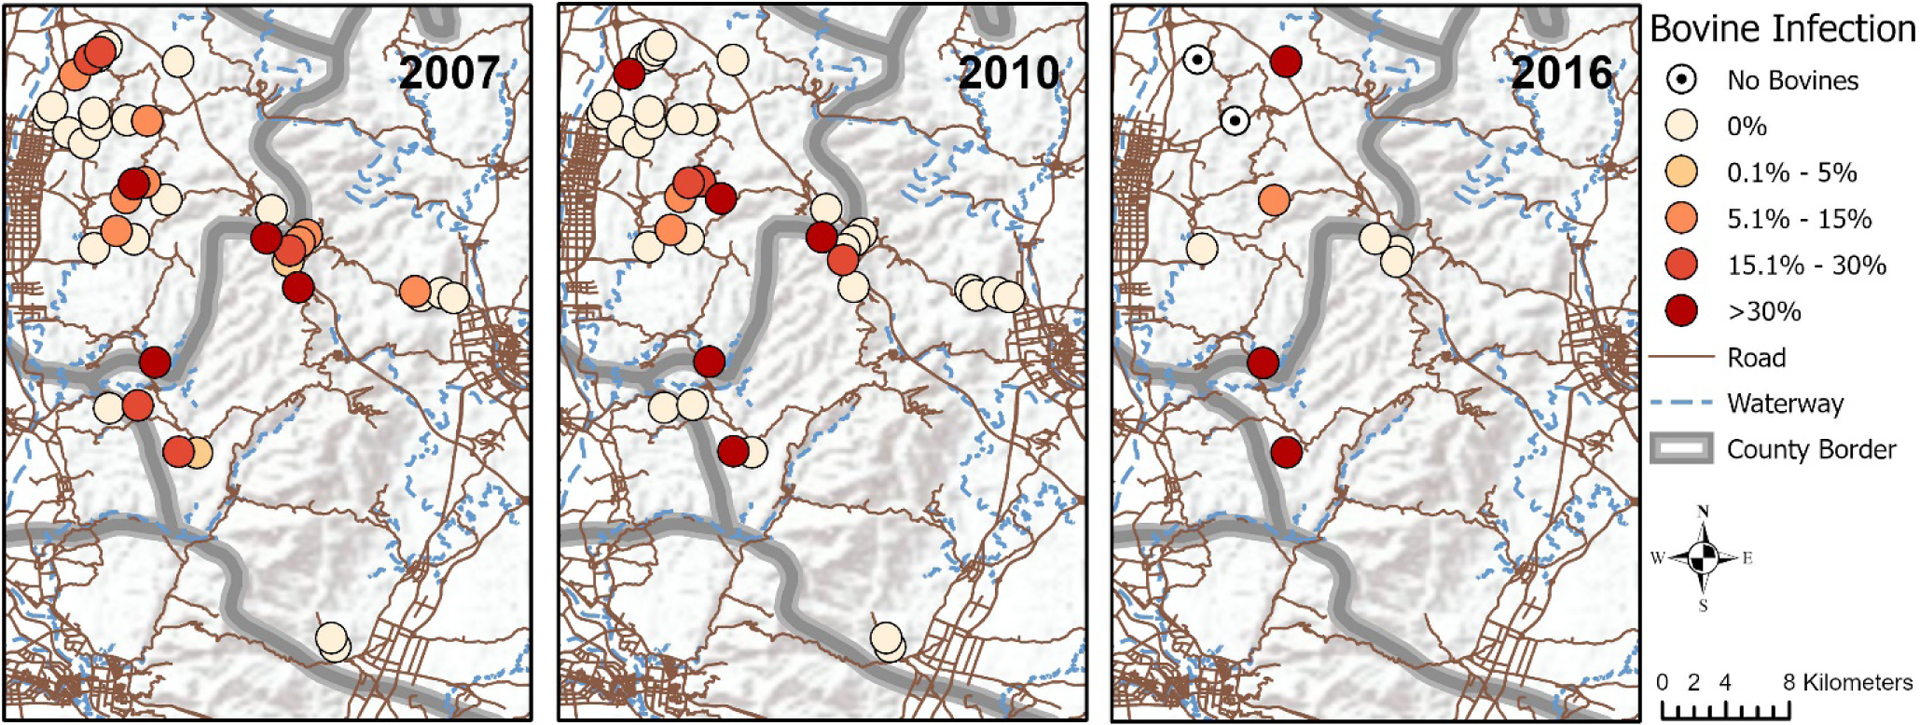
Village-level prevalence of schistosomiasis in bovines in 2007, 2010 and 2016. The prevalence of schistosomiasis infection in bovines is indicated for each village included in 2007, 2010 and 2016. The darker the shade, the higher the prevalence. While villages in the lower left corner of each map were found to have repeatedly high infection prevalence, other villages achieved 0% infection in bovines in later years (upper left and center right of maps), while still others emerged as high prevalence villages in 2010 (center of maps) and 2016 (upper left of maps) after years of low infection prevalence in bovines. Service Layer Credits: World Terrain Base Sources: Esri, USGS, NOAA. OpenStreetMap Data Extracts for China, Asia: Data/Maps Copyright 2018 Geofabrik GmbH and OpenStreetMap Contributors.