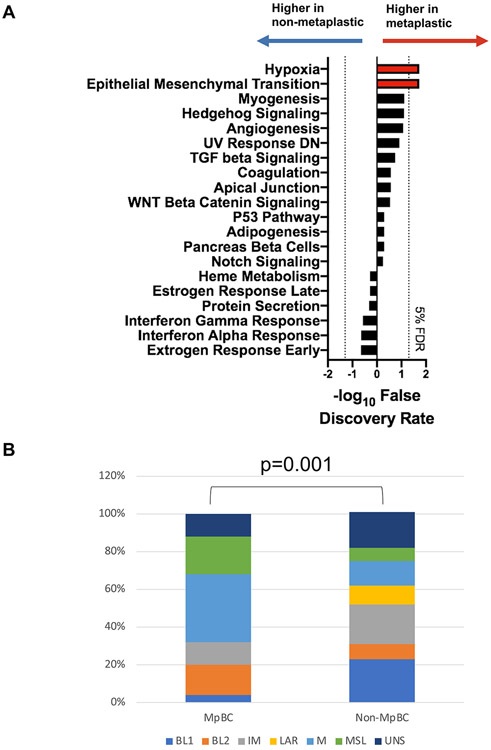
FIGURE 3. Metaplastic breast cancers (MpBCs) and non-metaplastic (non-Mp) TNBCs have distinct gene expression profiles.
(A) Bar plot showing the 10 Hallmarks pathways predicted to be most significantly activated in MpBC or non-MP TNBC. The x-axis shows the −log10 of the false discovery rate (FDR), where the values for the pathways associated with non-Mp TNBCs are inversed so that the most significant ones go to the left. The pathways most significantly associated with MpBCs go to the right and are shown in red. The dotted lines indicate a 5% FDR. (B) Stacked bar graph showing the distribution of TNBC subtypes (legend) within MpBCs (left) and non-Mp TNBCs (right).

