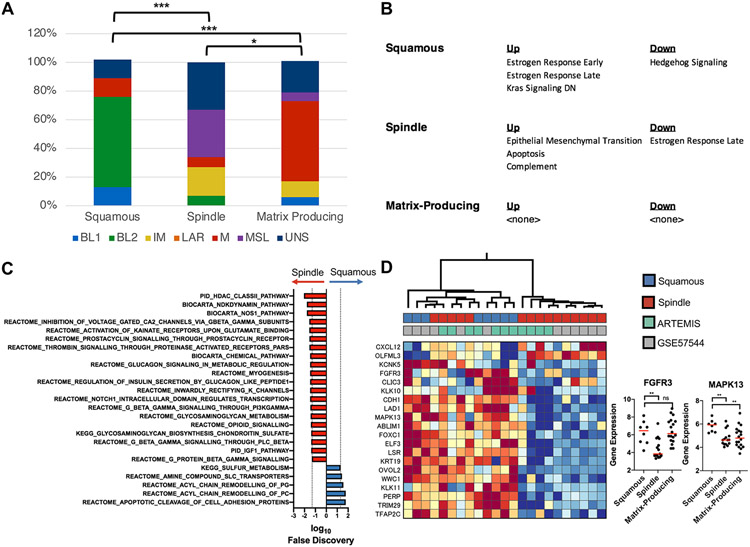
FIGURE 4. Histologic subtypes of metaplastic breast cancer (MpBC) have heterogeneous gene expression profiles.
(A) Stacked bar graphs showing the distribution of TNBC subtypes within each histologic subtype of MpBC. The distribution of TNBC subtypes across the columns were compared, and the statistical significance is indicated according to: * p < 0.05, ** p < 0.01, *** p < 0.001, and **** p < 0.0001. (B) The Hallmarks pathways that are predicted to be up- or down- regulated (false discovery rate [FDR] < 5%) in each of the histologic subtypes of MpBC are shown. (C) The Canonical pathways that are enriched in the spindle (red bars, towards the left) and squamous (blue bars, towards the right) at a 5% FDR cutoff are shown. (D) Heatmap showing the expression levels of the significant genes (rows) from the Hallmarks Estrogen Response pathways across the MpBCs (columns). The colors indicate the normalized expression values of the genes, where warm and cold colors indicate higher and lower expression, respectively. The first row of boxes under the dendrogram show the subtype of the metaplastic tumors, and the second row indicates the data set. Beeswarm plots (right panel) show the expression level of FGFR3 and MAPK13 across each of the histologic subtypes of MpBCs (x-axis). The statistical significance is denoted using the same notation as in Fig 4A.

