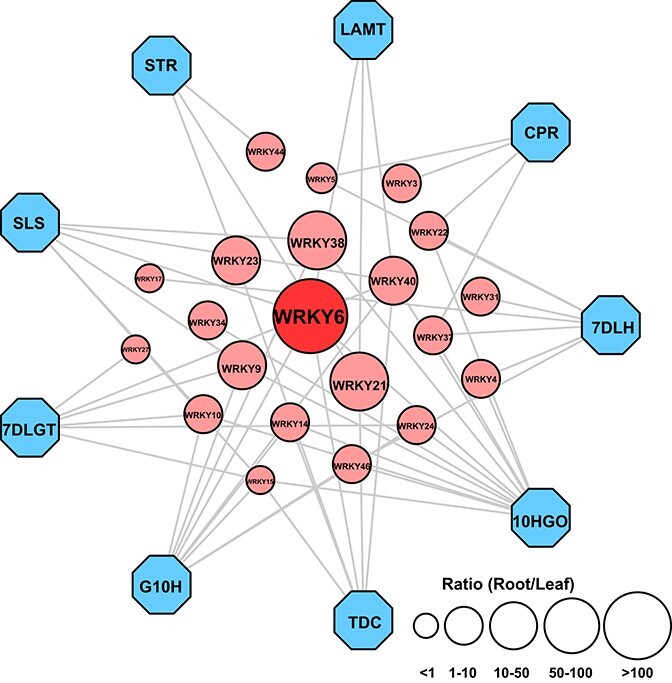
Figure 5.

Correlation analysis of OpWRKY genes with camptothecin biosynthetic pathway genes in O. pumila. Blue octagons and red circles represent camptothecin biosynthetic pathway genes and OpWRKY genes, respectively. Larger circles indicate higher expression levels of OpWRKY genes in roots compared with leaves. Edges are drawn when the linear correlation coefficient is >0.8 with p-value <0.05.
