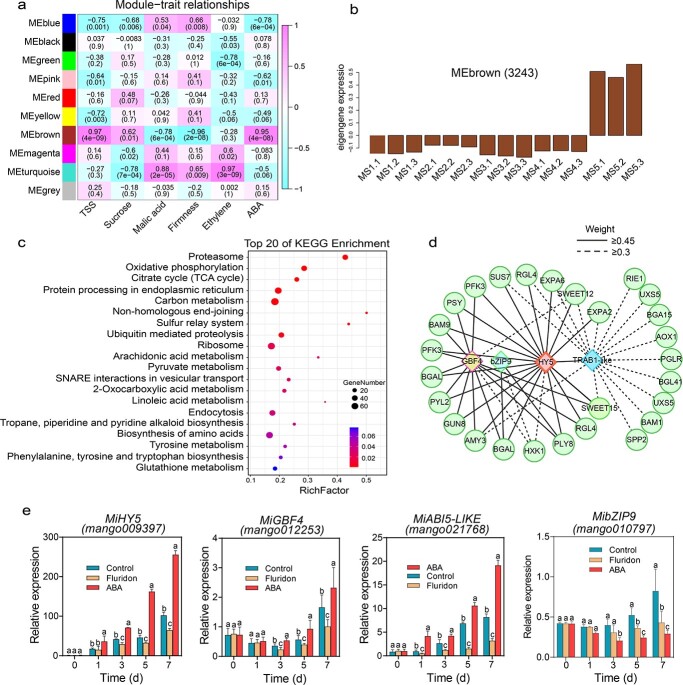
Figure 5.
‘Keitt’ fruit ripening-related regulatory network and key genes. a Correlations between module and trait. The number in each cell represents the correlation coefficient and the p value. b Expression pattern of genes in MEbrown. c KEGG analysis of 3243 genes in the MEbrown module. d Co-expression network analysis of four bZIP-type TFs (MiGBF4, MibZIP9, MiHY5, and MiABI5-like) and ripening-associated genes in the MEbrown module. Solid and dashed lines indicate the weighted Pearson correlation coefficient values for each gene pair. e Expression levels of MiGBF4, MibZIP9, MiHY5, and MiABI5-like after application of ABA and its inhibitor by RT–qPCR analysis. Different letters stand for significant differences in different stages calculated through one-way ANOVA (P < .05). Error bars stand for the standard deviation of five replicates. Complete data can be found in Supplementary Data Table S7. Primers are listed in Supplementary Data Table S10.

