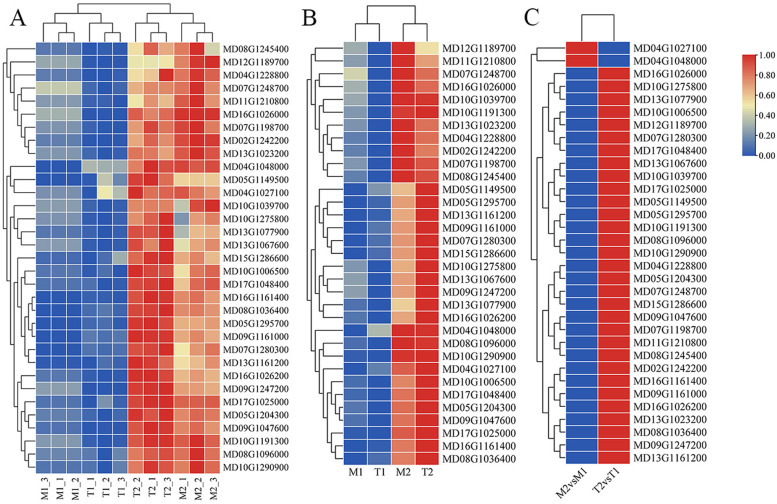
Fig. 7.
Validation of the expression patterns for genes selected from RNA-seq analysis by realtime qRT-PCR. Gene expression values were obtained by normalizing the values. GAPDH was used as aninternal control. A Differences in gene expression levels among different treatments. B Differences in mean gene expression levels among different treatments. C The qRT-PCR data ratio of up-regulated DEGs of M9T337 (T) or M.26 (M) dataset. The color intensity was proportional to the normalizing the values. Taxa relative abundances were log10-transformed, and the scale method (from zero to one) was used for the heatmap representation. Each treatment included three repetitions

