

Abstract
Background:
Cannabis is the most widely used illicit drug in the United States and is often associated with changes in attention function, which may ultimately impact numerous other cognitive faculties (e.g., memory, executive function). Importantly, despite the increasing rates of cannabis use and widespread legalization in the United States, the neural mechanisms underlying attentional dysfunction in chronic users are poorly understood.
Methods:
We used magnetoencephalography (MEG) and a modified Posner cueing task in 21 regular cannabis users and 32 demographically-matched non-user controls. MEG data were imaged in the time-frequency domain using a beamformer and peak voxel time series were extracted to quantify the oscillatory dynamics underlying use-related aberrations in attentional reorienting, as well as the impact on spontaneous neural activity immediately preceding stimulus onset.
Results:
Behavioral performance on the task (e.g., reaction time) was similar between regular cannabis users and non-user controls. However, the neural data indicated robust theta-band synchronizations across a distributed network during attentional reorienting, with activity in the bilateral inferior frontal gyri being markedly stronger in users relative to controls (p’s < .036). Additionally, we observed significantly reduced spontaneous theta activity across this distributed network during the pre-stimulus baseline in cannabis users relative to controls (p’s < .020).
Conclusions:
Despite similar performance on the task, we observed specific alterations in the neural dynamics serving attentional reorienting in regular cannabis users compared to controls. These data suggest that regular cannabis users may employ compensatory processing in the prefrontal cortices to efficiently reorient their attention relative to non-user controls.
INTRODUCTION
Following tobacco and alcohol, cannabis is the most widely used psychoactive substance in the United States (Azofeifa et al., 2016; Carliner et al., 2017), with an estimated 24 million Americans aged 12 or older found to be current users of cannabis in 2016 (SAMHSA, 2017). The main psychoactive component of cannabis is Δ9-tetrahydrocannabiol (THC), which acts, most notably, as an agonist of the endocannabinoid CB1 receptor (CB1R; (Bloomfield et al., 2019). CB1R is a common G-protein-coupled receptor that is found in high concentrations in the neocortex (particularly frontal and limbic areas), hippocampus, amygdala, cerebellum, thalamus, and the basal ganglia (Bloomfield et al., 2019). Concomitant with widespread CB1R activation are cognitive and behavioral changes that occur with acute (i.e., online, current use) and chronic cannabis use (i.e., persistent, repetitive use), including memory, executive functioning, and attentional deficits (Bloomfield et al., 2019; Broyd et al., 2016; Cohen & Weinstein, 2018; Ganzer et al., 2016; Lovell et al., 2019; Scott et al., 2018). However, the neurobiological mechanisms underlying such cognitive dysfunction in the context of acute and chronic cannabis use remains poorly understood.
One behavioral hallmark of acute cannabis intoxication includes difficulty attending to pertinent stimuli in the environment, which may ultimately impact other cognitive domains including memory, executive, and motor functioning (Broyd et al., 2016). While this relationship between cannabis use and the impairment of attentional domains (e.g., focused, divided, and sustained attention) is well established in acute users of cannabis (Broyd et al., 2016; Cohen & Weinstein, 2018; Scott et al., 2018), the effect of chronic, persistent cannabis use on attention function is far less understood (Broyd et al., 2016; Cohen & Weinstein, 2018; Ganzer et al., 2016). In fact, the available data in this area is broadly conflicting (for an excellent review see (Cohen & Weinstein, 2018)), although this may be related to methodological considerations, including significant sample heterogeneity across studies. For example, inclusion criteria for chronic cannabis use varies widely from study to study, such as the amount of current use, the duration of use prior to study enrollment, and the duration of abstinence from cannabis use prior to study assessments (Ganzer et al., 2016). Recently, meta-analytical approaches (Lovell et al., 2019; Schreiner & Dunn, 2012; Scott et al., 2018) have helped clarify the cognitive effects of chronic cannabis use. Taken together, there seem to be reasonable agreement that there are attentional deficits associated with chronic cannabis use that become less severe and even insignificant when users abstain from the drug for an extended period. Another factor crucial to the impact of cannabis on cognitive function is the age at which individuals start using cannabis. Specifically, it has been demonstrated that participants who began using cannabis at earlier ages tend to have worse cognitive function (Bosker et al., 2013; Hooper et al., 2014) and decreased cortical gray matter volumes (Wilson et al., 2000). Similar to the neuropsychological findings, neuroimaging studies have shown inconsistent results with regards to differences between cannabis users and nonusers. While some studies have found changes in brain morphology and activation patterns in cannabis users (Gilman et al., 2019; Jager et al., 2007; Lopez-Larson et al., 2015; Schweinsburg et al., 2008; Wilson et al., 2000), others have found no such differences between cannabis users and nonusers (Block et al., 2000; Jager et al., 2006; Tzilos et al., 2005).
Productive daily life depends upon one’s ability to orient and reorient their attention to behaviorally pertinent stimuli and information. These attentional processes are thought to be served by the interaction between two neural networks: the dorsal attentional network (DAN) and the ventral attentional network (VAN; (Chica et al., 2013; Corbetta et al., 2008; Corbetta & Shulman, 2002)). The DAN appears to be involved in top-down control processes based on current objectives and preexisting information, and includes activation of bilateral superior parietal lobules, intraparietal sulci, and frontal eye fields. In contrast, the VAN has been shown to be involved in bottom-up detection of goal-relevant stimuli (Corbetta et al., 2008), with key hubs in the right temporoparietal junction and the ventral prefrontal cortices. Importantly, regions within both networks are activated upon the detection of behaviorally relevant targets and further amplified when attentional resources need to be reallocated to more behaviorally-relevant stimuli (Corbetta et al., 2008). In addition to the neuroanatomical origins serving these attentional processes, recent studies have shown such activation is comprised of multispectral neural oscillatory responses within these networks during attention reallocation (Arif, Spooner, et al., 2020; Arif, Wiesman, et al., 2020; Proskovec et al., 2018; Spooner et al., 2020).
While the neural processes serving attention and attentional reorientation have been extensively studied, the impact of regular cannabis use on these processes remains poorly understood. Thus, we examined the neural oscillatory dynamics underlying attentional reorienting in demographically-matched users and nonusers using magnetoencephalography (MEG) and a modified Posner cueing task. The Posner task is a well-vetted attention paradigm that is commonly used to investigate the reorienting of attentional resources to novel target locations by either validity or invalidly cueing the participant to the location of the upcoming target stimulus, which induces a robust behavioral effect termed the validity effect (Arif, Spooner, et al., 2020; Arif, Wiesman, et al., 2020; Chica et al., 2013; Daitch et al., 2013; Macaluso & Patria, 2007; Posner, 1980; Proskovec et al., 2018; Spooner et al., 2020; Thiel et al., 2004; Vossel et al., 2006; Vossel et al., 2012; Wiesman & Wilson, 2019). Importantly, the validity effect refers to a behavioral decrement (e.g., slowing reaction time) in response to invalidly-cued targets, which are targets that appear in a different spatial location than the previous spatial cue. This effect is reflected in the brain through greater activation in key DAN and VAN nodes for invalidly-cued trials compared to valid ones (Corbetta et al., 2008; Posner, 1980). Based on previous literature, we hypothesized that the reorienting of attention would involve temporally-sustained decreases in alpha and beta activity during target processing in DAN hubs (e.g., superior parietal lobules). In contrast, we predicted that there would be robust, transient increases in theta oscillatory activity in the VAN (e.g., inferior frontal cortices) during target processing (Arif, Spooner, et al., 2020; Proskovec et al., 2018; Spooner et al., 2020; Wiesman et al., 2019). Considering the relatively low difficulty of the Posner task, we expected there to be little to no behavioral differences between the users and nonusers. Conversely, we expected there to be major differences in the oscillatory dynamics of users, indicative of compensatory neural mechanisms to maintain proper functionality compared to their nonuser counterparts, as has been shown in several major fMRI studies (Chang, 2006; Eldreth et al., 2004; Jager et al., 2006; Kanayama et al., 2004). Finally, we also hypothesized that chronic cannabis users would exhibit alterations in spontaneous neural activity prior to stimulus onset, further indicative of disrupted neural processing in the brain regions serving attention function (Böcker et al., 2010; Herning et al., 2003; Ilan et al., 2004).
METHODS AND MATERIALS
Participants
Fifty-three participants were enrolled in the study. Twenty-one active, regular cannabis users (7 females, mean age: 29.9, SD: 7.76) and 32 nonuser controls (13 females; mean age: 30.6, SD: 7.22). Exclusionary criteria included any medical illness affecting CNS function, neurological or psychiatric disorder, history of head trauma, and standard exclusionary criteria for MEG (e.g., any type of ferromagnetic implanted material). After a complete description of the study, written informed consent was obtained from each participant.
Participants were identified as regular cannabis users based on the following criteria: (1) at least weekly cannabis use over the past 12 months, (2) current use of at least four times per week, and (3) not currently using any other illicit drugs (e.g., cocaine, heroin, etc.). Importantly, participants were asked to refrain from using any cannabis containing products on the day of their MEG appointment, to avoid any contamination of neural/behavioral effects by acute substance use. Further, participants in the user group were screened for drug use on the day of examination to ensure that they were not using any drugs other than cannabis. In contrast, the nonuser group consisted of individuals with no current or past substance use, and were demographically matched to the user group based on age, sex, race, SES, and levels of depression (measured by the Beck Depression Scale). Of note, the groups differed on years of education and head motion during MEG, but inclusion of these variables in the final statistical models resulted in no changes to the results. Additionally, our experimental groups were matched on current alcohol use as measured via the Alcohol Use disorders Identification Test – Consumption (AUDIT-C) scores (controls – M: 2.72, SD: 1.53; users – M: 4.05, SD: 2.85), to ensure that any cannabis-related effects in our data were not confounded by between-group differences in alcohol consumption.
Experimental paradigm
During the MEG recording, participants performed a modified Posner task (Posner, 1980). As shown in Figure 1 and described in prior works, each trial consisted of a fixation crosshair for 1500ms (± 50ms), followed by a green bar (the cue) appearing on either the left or right of the crosshair for 100ms, a 200ms fixation cross, and then a target on either the left or right side for 2500ms. Importantly, the target could be validly (i.e., same side as cue; 50% of trials) or invalidly cued. Each cue location (left or right) and target (valid/invalid) appeared an equal number of times and participants responded as to the location of the opening in the target stimulus (top/bottom) using their right hand on a nonmagnetic button pad. Each trial lasted 4300 ms (± 50ms), with a total of 200 trials (100 valid, 100 invalid).
Figure 1. Posner cueing task and behavioral performance.
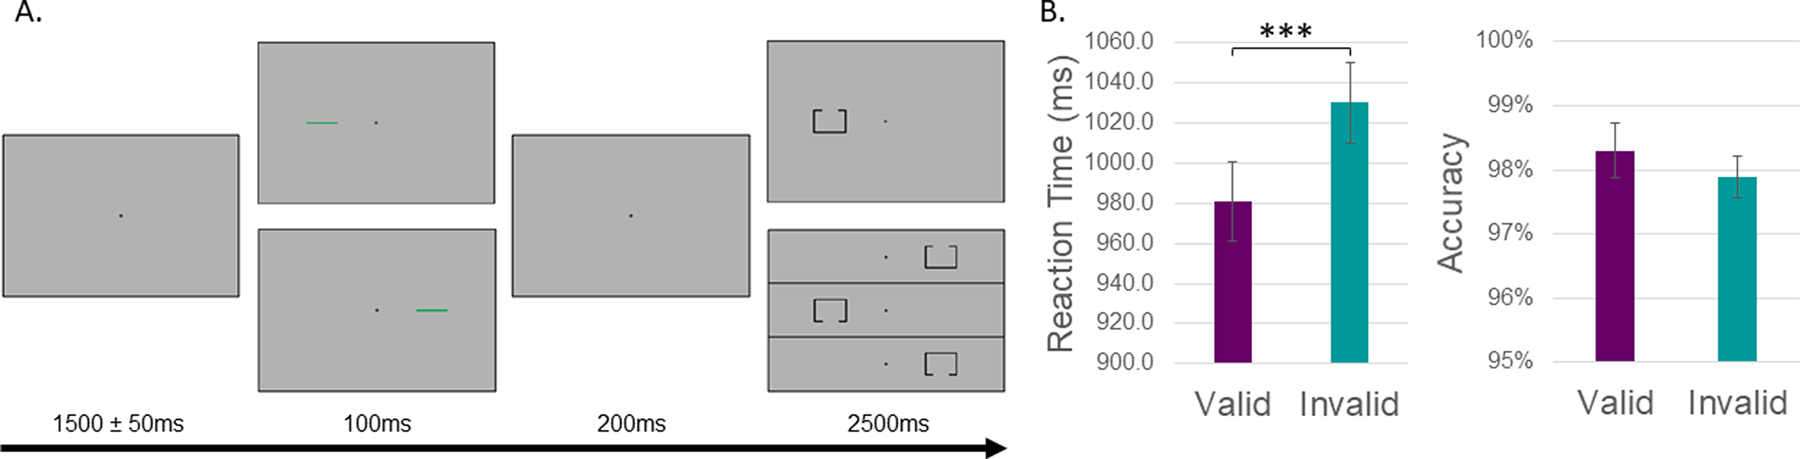
(A) A fixation cross was first presented for 1500 (±50) ms, followed by a cue (green bar) presented to the left or right of the fixation cross for 100 ms. After 200 ms, the target stimulus (box with opening) appeared in either the left or right hemifield for 2500 ms. Participants responded as to whether the opening was on the bottom or top of the target with their index and middle finger, respectively. Validly-cued trials (cue location on the same side as the impending target) were presented for 50% of the trials, and a total of 200 trials (both valid and invalidly-cued) were completed by each participant. (B) Behavioral performance of all subjects is shown on the y-axis (i.e., reaction time on the left, accuracy on the right) with condition (valid or invalid) on the x-axis. Reaction times were significantly slower during invalid trials compared to valid ones, while accuracy was unchanged as a function of task condition. ***p < .001
MEG data acquisition, preprocessing, and imaging
Neuromagnetic responses were sampled at 1kHz using an Elekta/MEGIN MEG system with 306 sensors. MEG data from each participant was individually corrected for head motion and subjected to noise reduction using the signal space separation method with temporal extension (Taulu & Simola, 2006). The continuous magnetic time series was divided into epochs of 4000ms duration, with the onset of the cue defined as 0 ms and the baseline defined as the 600ms preceding the cue onset (−600 to 0ms). Epochs containing artifacts were rejected based on a fixed threshold method. This process and the actual thresholds are described in the Supplemental Methods and, importantly, did not differ by group. Further, to ensure a balanced number of trials between groups and conditions, a mixed-model ANOVA was performed which showed no main effects of group, condition, nor interaction.
Artifact-free epochs were transformed into the time-frequency domain using complex demodulation (Kovach & Gander, 2016). The specific time-frequency windows used for subsequent imaging were determined using a stringent statistical analysis involving nonparametric permutation testing of the sensor-level spectrograms across the entire array of gradiometers (see (Proskovec et al., 2018; Spooner et al., 2020; Wiesman et al., 2018). Prior to image reconstruction, each participant’s MEG data were coregistered to their individual high-resolution structural MRI using three fiducial points, four MEG coils, and the scalp surface, which was digitized using a Polhemus (Supplementary Methods). Using a spherical head model, cortical networks were then imaged at 4.0 × 4.0 × 4.0 mm using the dynamic imaging of coherent sources beamformer (Gross et al., 2001). The DICS approach utilizes the cross-spectral density matrices computed from the sensor-level complex demodulation to estimate the data dependencies. Following convention, these images were normalized per voxel using a separately averaged prestimulus noise period (i.e., baseline) of equal duration and bandwidth (Hillebrand et al., 2005). To assess the anatomical basis of the responses identified through the sensor-level analysis, 3D maps were computed across both conditions and then averaged across all participants. To examine the effects of cannabis use, virtual sensors (i.e., voxel time series data) were extracted from each participant’s data using peak voxels. For each coordinate of interest, the envelope of spectral power was computed for the frequency range used in the beamforming analysis. From this, we computed the relative (i.e., baseline corrected) and absolute (i.e., non-baseline corrected) response time series of each participant per task condition by averaging the absolute amplitude timeseries across the baseline period (i.e., −600 to 0ms), and the relative time series across the time windows used for beamforming (i.e., theta: 350–700ms; alpha/beta: 300–900ms). Finally, mixed-model ANOVAs were conducted to evaluate changes in task-related neural oscillations during target processing as a function of task validity, cannabis use, and their interaction, while two-sample t-tests were used to assess differences in spontaneous baseline activity.
Results
Behavioral analysis
A mixed-model ANOVA of cue-validity, group, and their interaction on reaction time (RT) and task accuracy was conducted. In regard to reaction time, we observed a significant main effect of cue validity (F1,51 = 107.93, p < .0001), such that participants were significantly slower to respond to invalid (M = 1030.2ms, SD = 145.7ms) compared to valid trials (M = 981.1ms, SD = 143.1ms). Interestingly, there was no main effect of group (F1,51 = 0.014, p = .907), nor a cue validity-by-group interaction on reaction time (F1,51 = 1.663, p = .203). In regard to task accuracy, we observed no main effect of cue validity (F1,51 = 1.11, p = .297), group (F1,51 = 3.94, p = .053), nor validity-by-group interaction (F1,51 = 1.11, p = .297).
Sensor-level analysis
Since the goal of the study was to investigate the oscillatory dynamics associated with attention allocation during target processing, we focused our analysis on the time periods following target presentation (i.e., after 300ms). Statistical analyses of the time-frequency spectrograms during the target interval revealed significant clusters of theta (3–6 Hz), alpha (9–13 Hz), and beta (15–23 Hz) oscillatory activity across all participants and conditions (Figure 2). The significant theta synchronizations began around 50 ms after target presentation and tapered off about 350 ms later (350–700 ms; p < .001, corrected). Strong desynchronizations in alpha and beta were much more temporally extended with significant decreases beginning around the onset of the target interval and continuing for ~600 ms (300–900ms; p < .001, corrected).
Figure 2. Sensor-level analyses during attentional reallocation.
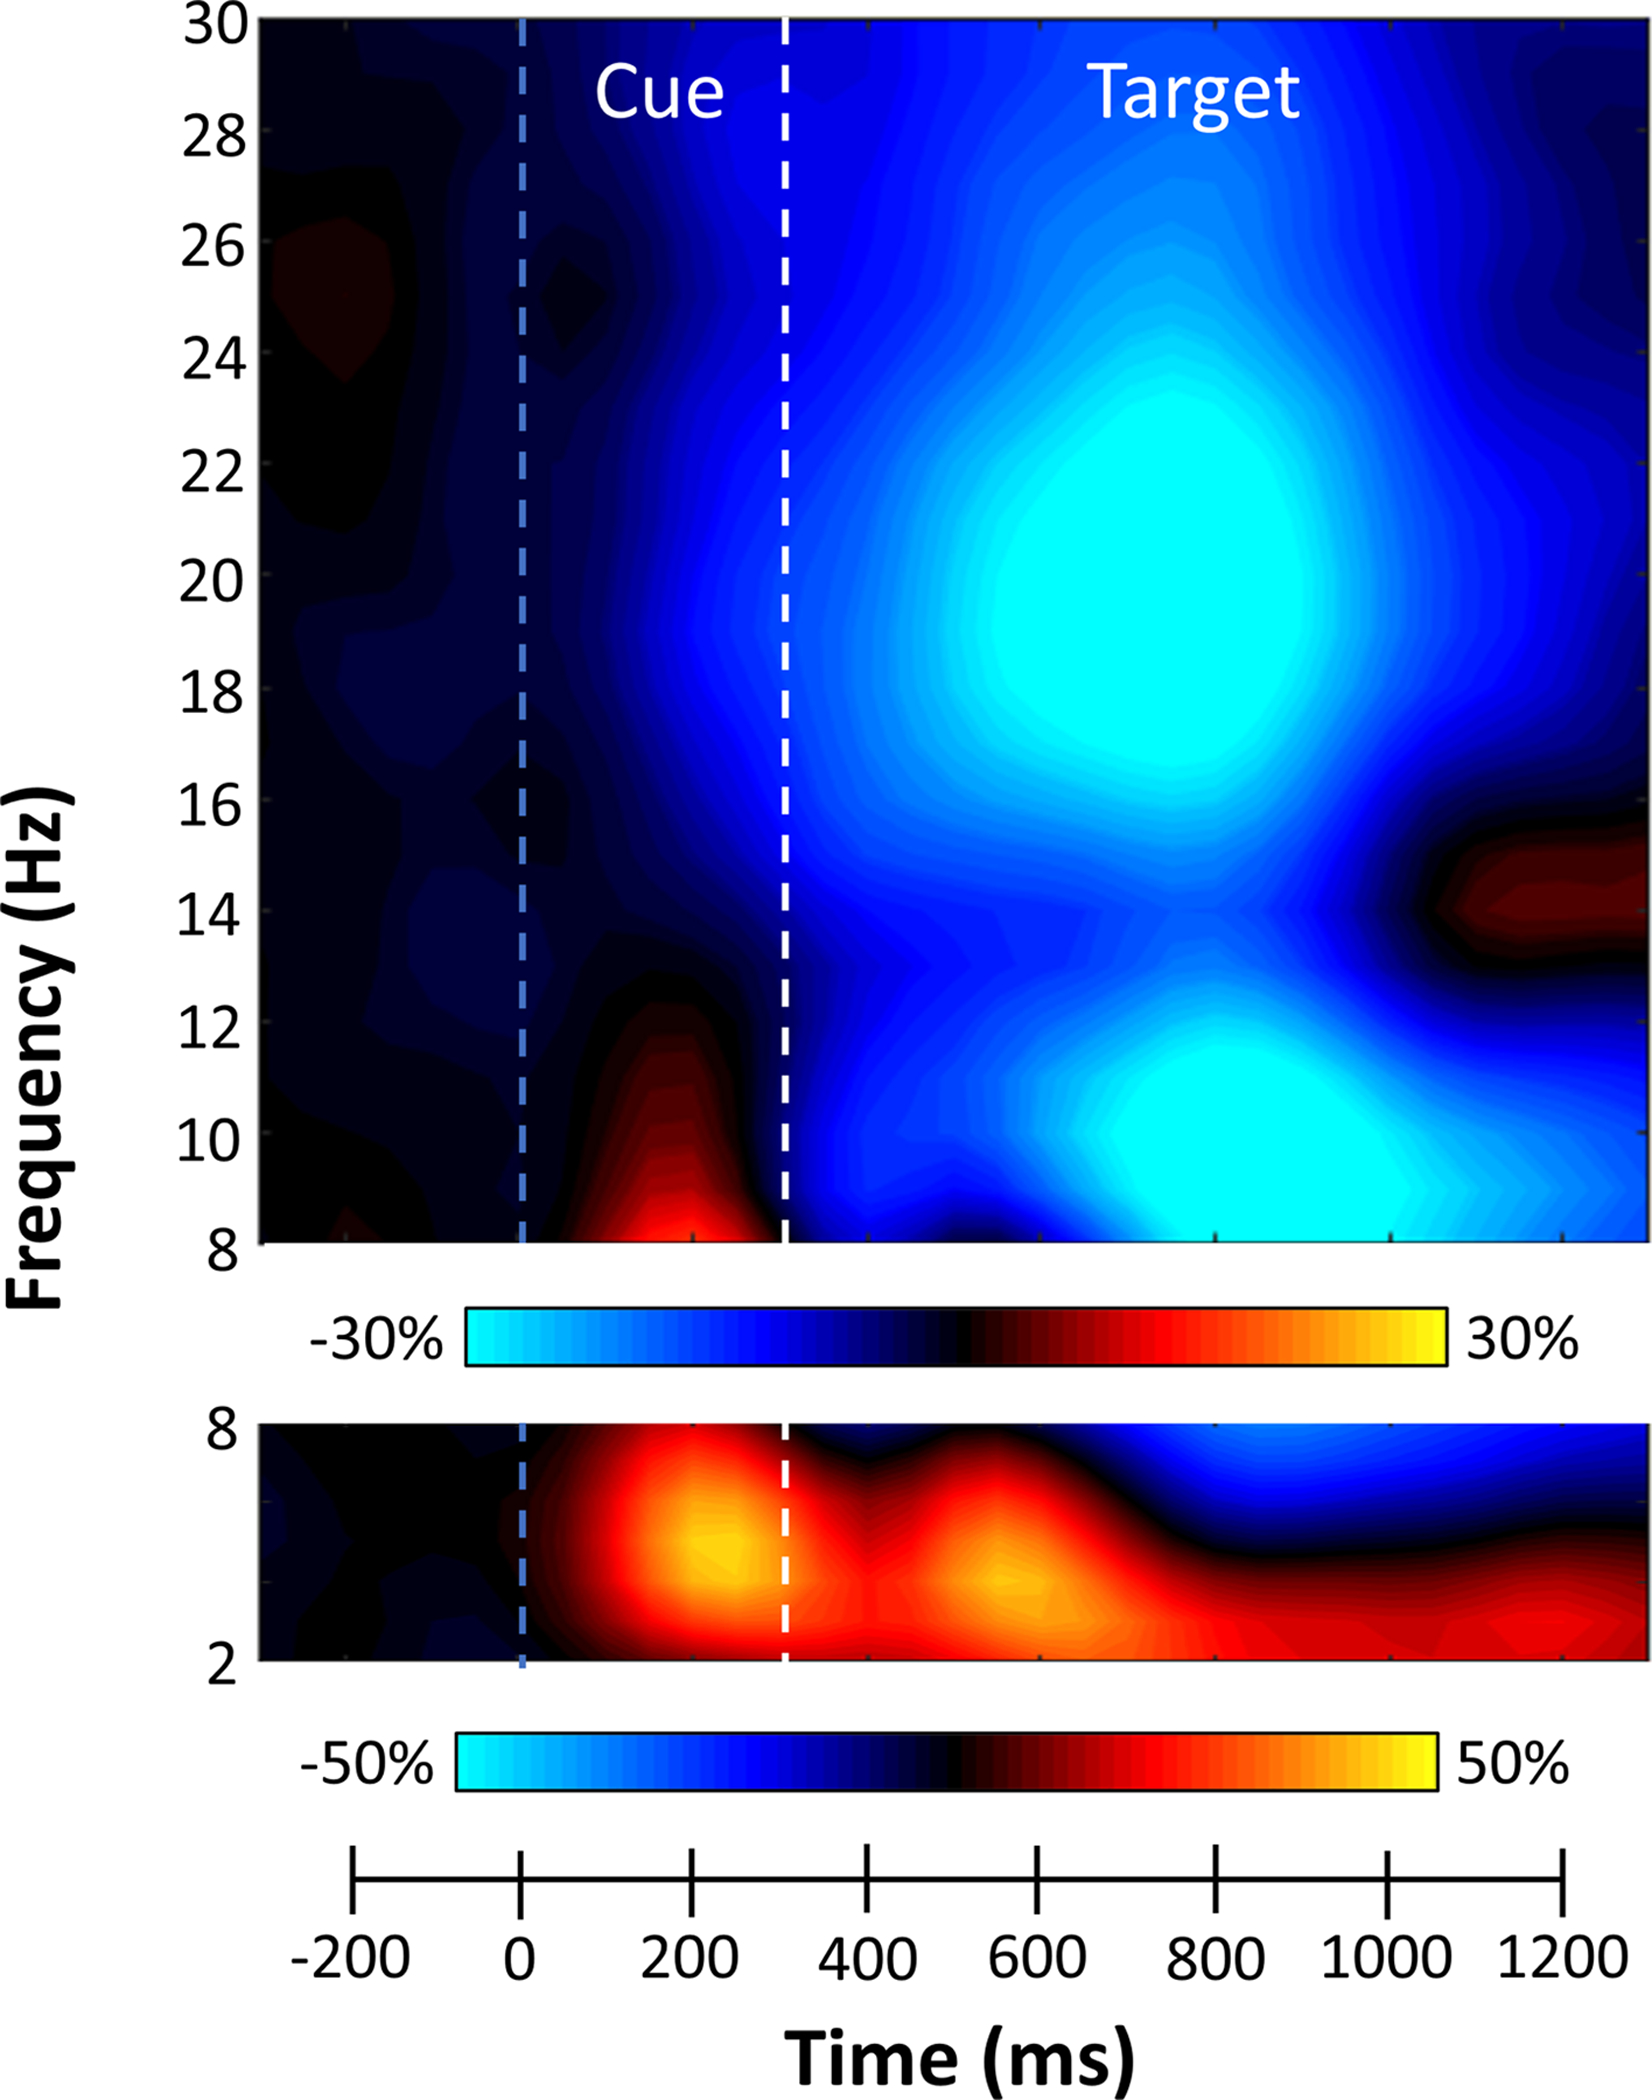
Grand-averaged time-frequency spectrogram from a sensor near the left posterior parietal cortex, with time (ms) shown on the x-axis and frequency (Hz) denoted on the y-axis. A color scale bar shown above the spectrogram denotes the percent power change relative to the baseline period (−600 to 0 ms). The data per spectrogram have been averaged across all trials (both valid and invalid) and participants. Strong increases in theta (3–6 Hz) were observed following cue (blue dashed line) and target (white dashed line) onset. Additionally, robust decreases in alpha (9–13 Hz) and beta (15–23 Hz) activity were observed following target presentation.
Beamformer and Virtual Sensor analysis
Strong increases in theta activity were observed from 350–700 ms in the bilateral primary visual cortices, bilateral inferior frontal gyri (IFG), and right dorsolateral prefrontal cortex (dlPFC) (Figure 3, insets). In contrast, strong decreases in alpha activity were observed from 300–900 ms in the lateral occipital gyri (LOG) bilaterally, left primary motor cortex, and bilateral intraparietal sulci (IPS; see Supplemental Materials). In regard to beta, strong decreases were observed from 300–900 ms in the bilateral LOG, left primary motor cortex and right superior parietal lobule (SPL; Figure 4, insets). Importantly, alpha and beta decreases in the left primary motor cortex were not further evaluated, as previous work has tightly linked these responses to motor planning and execution processes (Heinrichs-Graham et al., 2016; Heinrichs-Graham et al., 2017; Heinrichs-Graham & Wilson, 2015), which are beyond the goals of the current study.
Figure 3. Theta activity during target processing.
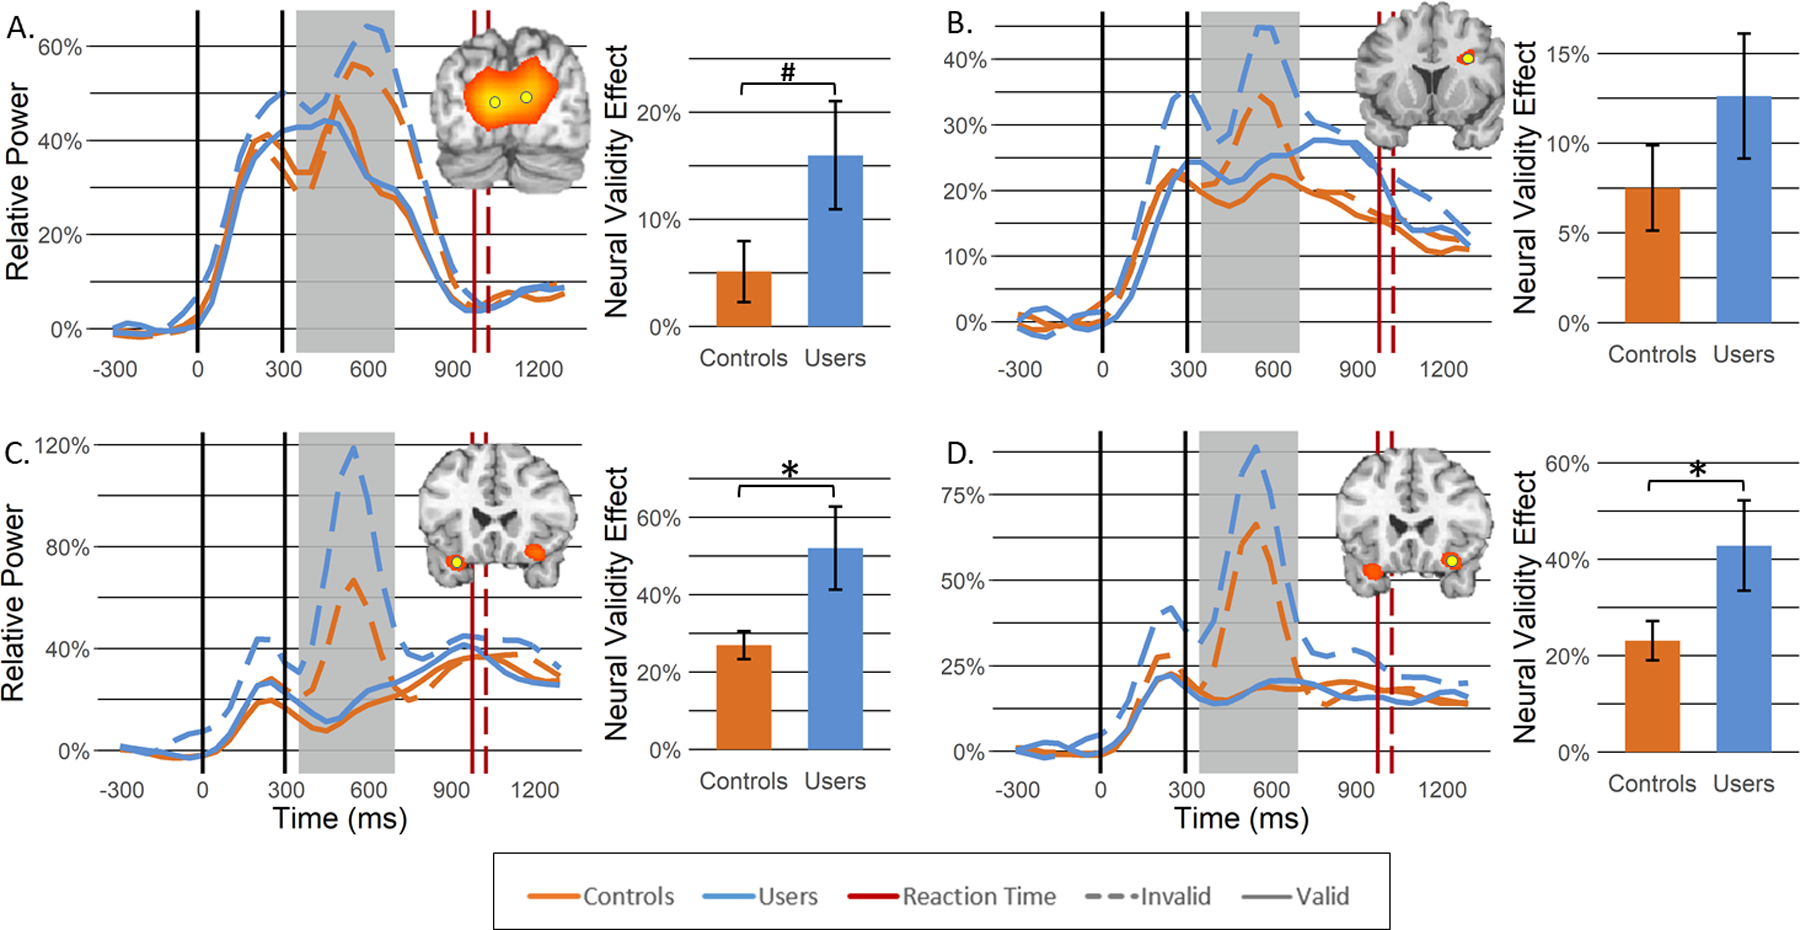
Theta beamformer images (inset top right) were computed across both conditions and then averaged across all participants. The images are shown in pseudo-t units following the neurological convention (right hemisphere on the right side). Increases in theta activity were observed in the following regions: (A) bilateral primary visual cortices, (B) right dorsolateral prefrontal cortex, (C) left inferior frontal gyrus, and (D) right inferior frontal gyrus. From the peak voxel exhibiting the strongest neural activity (yellow dot), time courses were extracted to evaluate changes in neural response as a function of group (controls: orange; users: blue) and task condition (valid: solid line; invalid: dashed line) during the target processing time window identified through the sensor level analysis (i.e., 350–700 ms; shaded area). Average reaction times across all participants for valid and invalid trials are denoted in red solid and dashed lines, respectively. Bar graphs represent the neural validity effect (i.e., invalid—valid) with error bars reflecting SEM. *p < .05; #p = .0502. Insets showing occipital responses are in units of pseudo-t values scaled from 8.0 to 12.0 while the other insets are scaled from 5.0 to 6.0.
Figure 4. Beta activity during target processing.
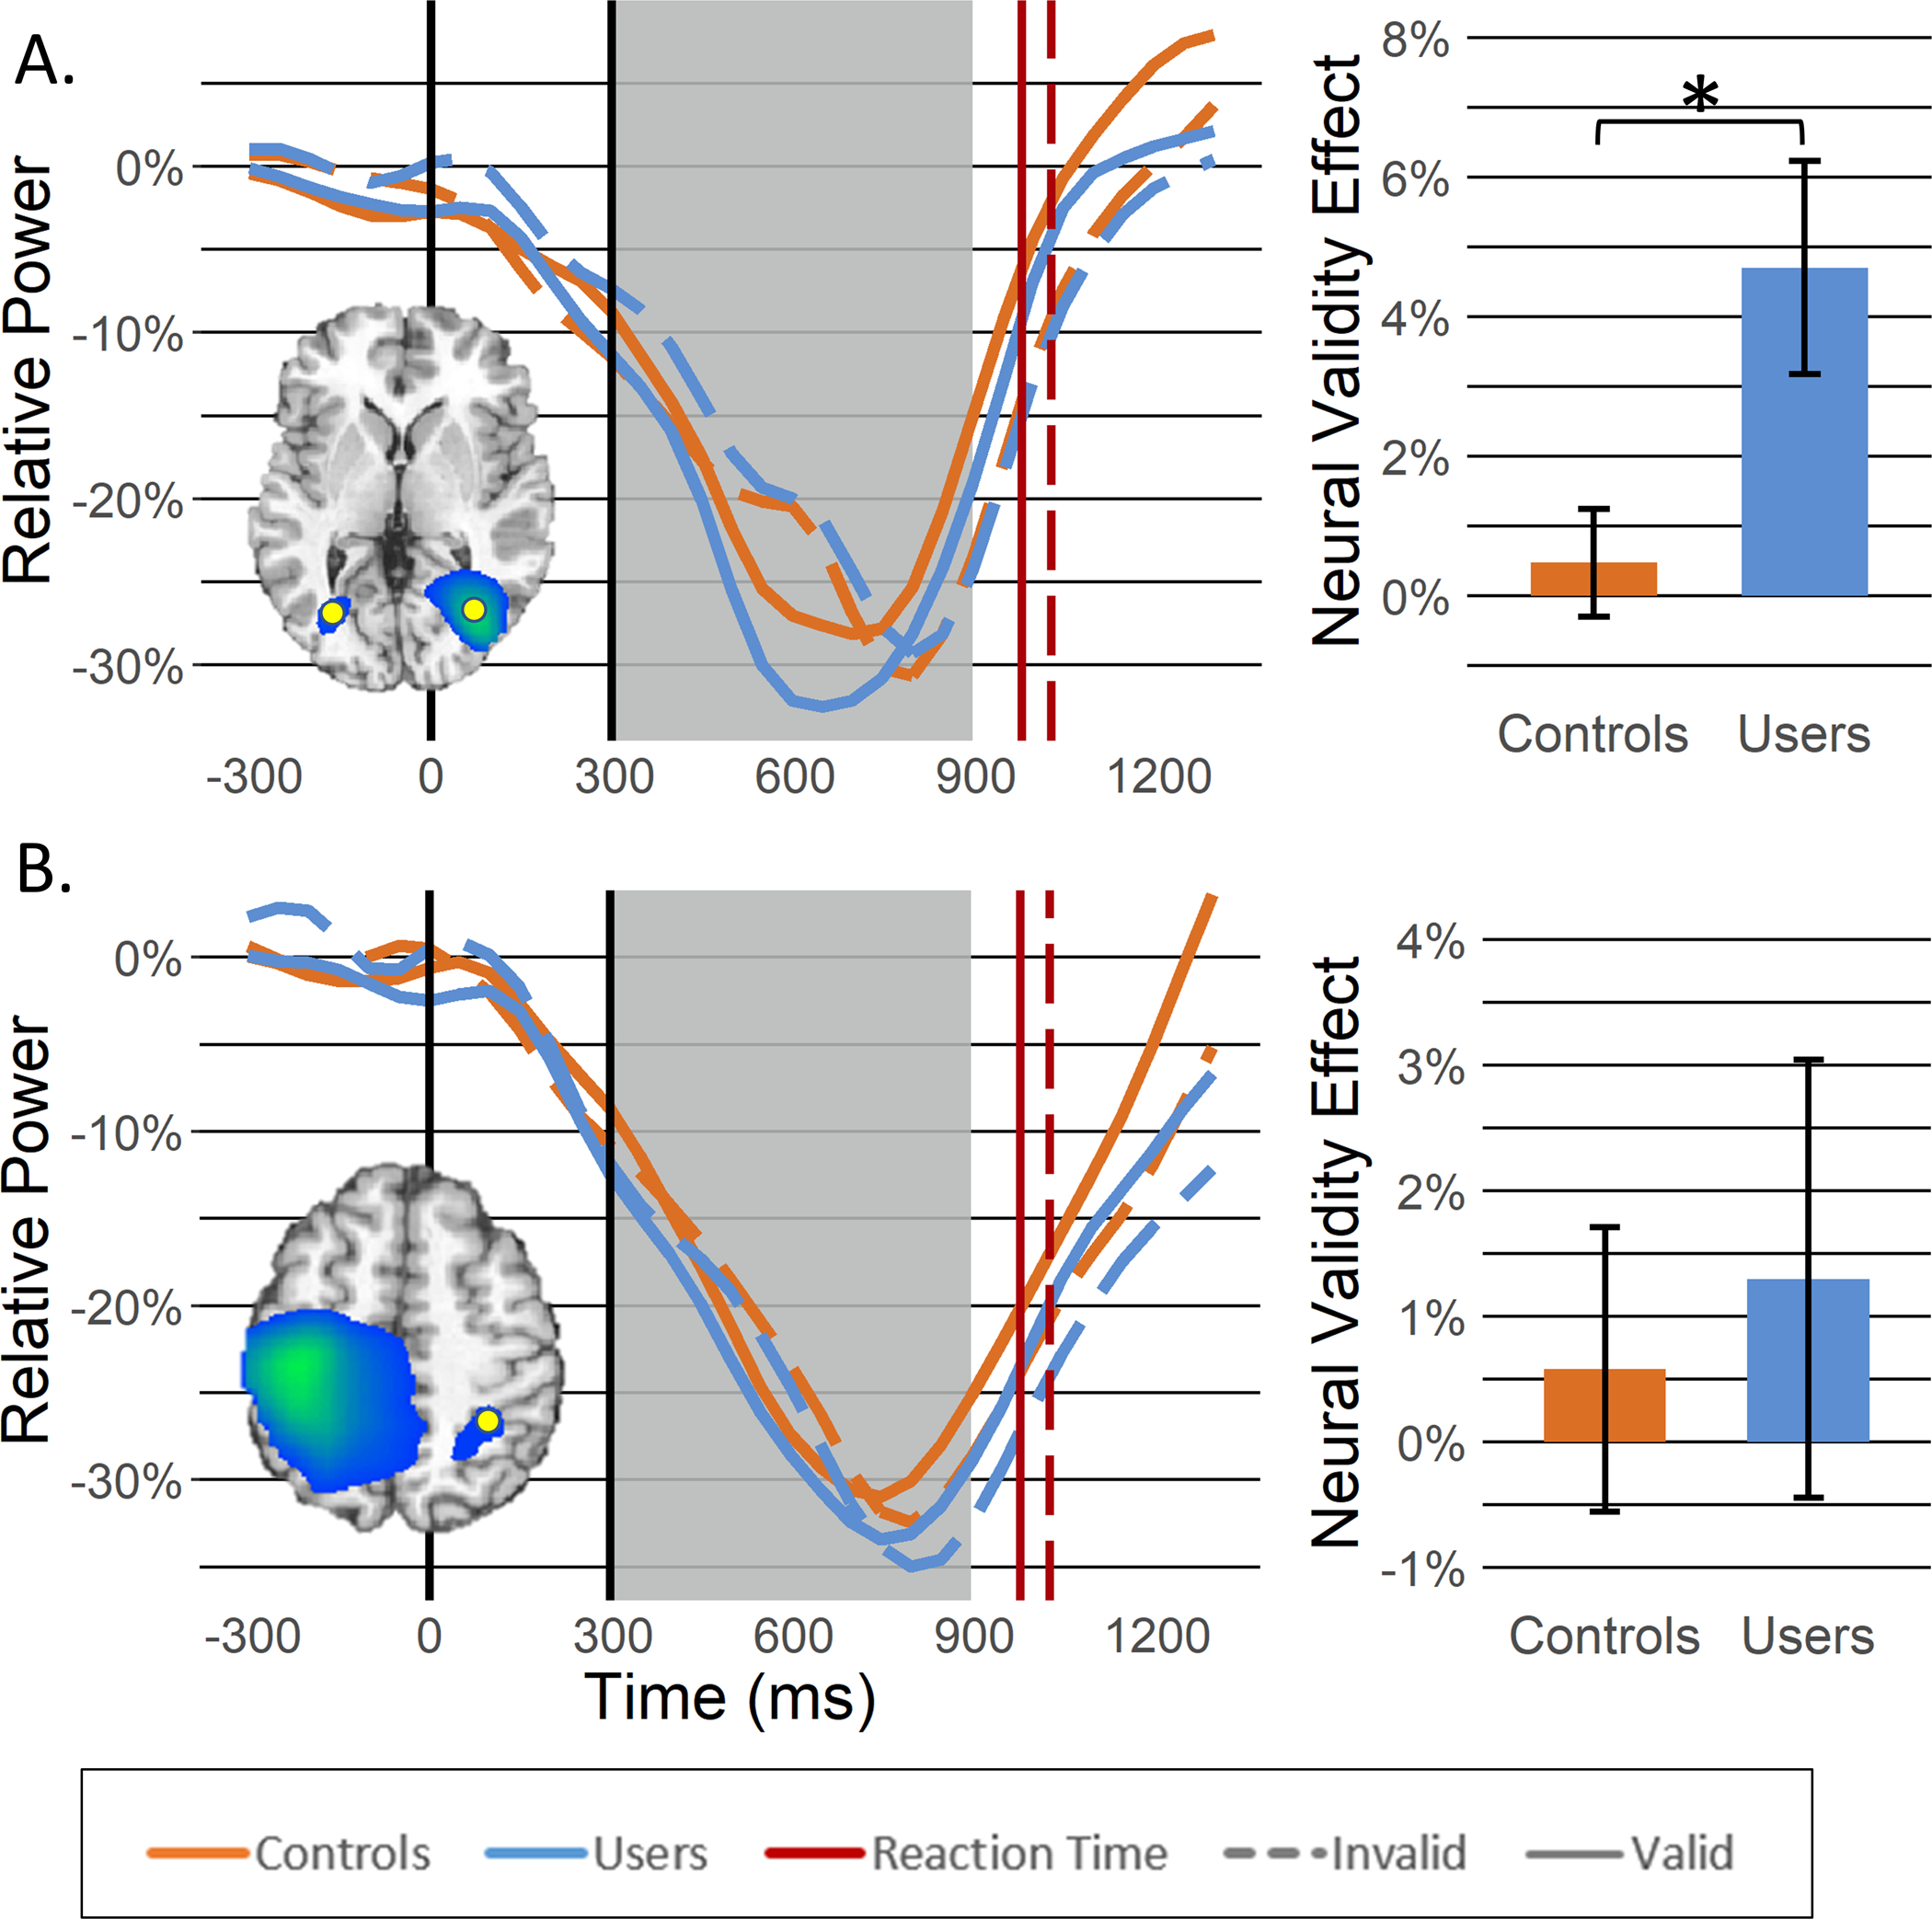
Beta beamformer images (inset) were computed across conditions and then averaged across all participants. The output images are shown in pseudo-t units following the neurological convention (right hemisphere on the right side). Decreases in beta activity were observed in the following regions: (A) lateral occipital gyri and (B) right superior parietal lobule. Time courses (i.e., line graphs) of beta activity from the peak voxel (i.e., yellow dot on beamformer images) in each region were averaged over the beamforming window (i.e., 300–900 ms; gray box) and the difference was calculated across conditions (i.e., invalid – valid) to determine the neural validity effect (bar graphs). Asterisks mark significant neural validity effects (p < .05), with error bars reflecting SEM. The inset showing occipital responses is in units of pseudo-t values scaled from 12.0 to 16.0 while the other inset is scaled from 13.0 to 21.0.
To quantify the spectrotemporal dynamics in these regions and evaluate differences in the processing of valid and invalid targets as a function of cannabis use, we used mixed-model ANOVAs with cue validity (valid/invalid), group (users/non-users) and their interaction as factors of interest. Note that we did not collapse across hemisphere for frontal or parietal responses, as there is clear evidence of hemispheric specialization for attention function in these brain regions.
Theta activity increased during target processing in all four regions, with stronger activity elicited during the processing of invalid relative to valid trials (bilateral visual: F1,50 = 15.20, p < .001; right DLPFC: F1,50 = 24.47, p < .001; right IFG: F1,48 = 52.24, p < .001; left IFG: F1,50 = 60.47, p < .001). Activity in the left IFG also demonstrated a significant main effect of group, such that cannabis users exhibited stronger theta activity during target processing compared to controls (F1,50 = 8.58, p = .005). Finally, we observed a significant cue validity by group interaction bilaterally in the IFG (left IFG: F1,50 = 8.42, p = .006; right IFG: F1,48 = 4.68, p = .035) and a trend towards significance in the bilateral visual cortices (F1,50 = 4.03, p = .0502), such that greater theta activity during invalidly-cued targets was accentuated in regular cannabis users compared to non-users(Figure 3). To ensure that the IFG responses were not related to saccadic eye-movements during invalid trials, a supplemental sensor-level analysis was performed, and this showed that there were no detectable eye movements in the frontal sensors (Figure S2).
In contrast to theta activity, alpha power decreased during target processing in the left and right IPS and LOG (Figure S1). We observed stronger decreases in alpha power during validly-cued compared to invalidly-cued targets in all three brain regions (bilateral LOG: F1,50 = 5.00, p = .030; left IPS: F1,50 = 4.35, p = .042; right IPS: F1,51 = 5.71, p = .021), but there were no significant main effects of group nor interactions in any region (ps > .447).
Similarly, large decreases were also observed in the beta range throughout target processing in the bilateral LOG and right superior parietal lobule. Interestingly, stronger decreases in beta activity were observed during valid compared to invalid trials in the bilateral LOG (F1,51 = 13.07, p = .001), while this effect was not present in the right superior parietal lobule (F1,50 = .971, p = .329; Figure 4). Additionally, while there were no main effects of group in either region (ps > .603), there was a significant cue-validity by group interaction in the bilateral LOG, such that the neural validity effect (i.e., greater desynchronization during valid vs. invalid trials) was greater for regular cannabis users compared to non-users (F1,51 = 9.28, p = .004; Figure 4).
Finally, we evaluated whether regular cannabis use affects spontaneous neural activity (i.e., basal activity) during the baseline, and found that spontaneous theta was significantly decreased in cannabis users relative to non-users in the primary visual cortices, bilateral IFG, and right DLPFC (ps< .020; Figure 5). In contrast, baseline activity did not differ in any other regions exhibiting strong alpha/beta oscillations during target processing.
Figure 5. Spontaneous theta activity during the baseline period.
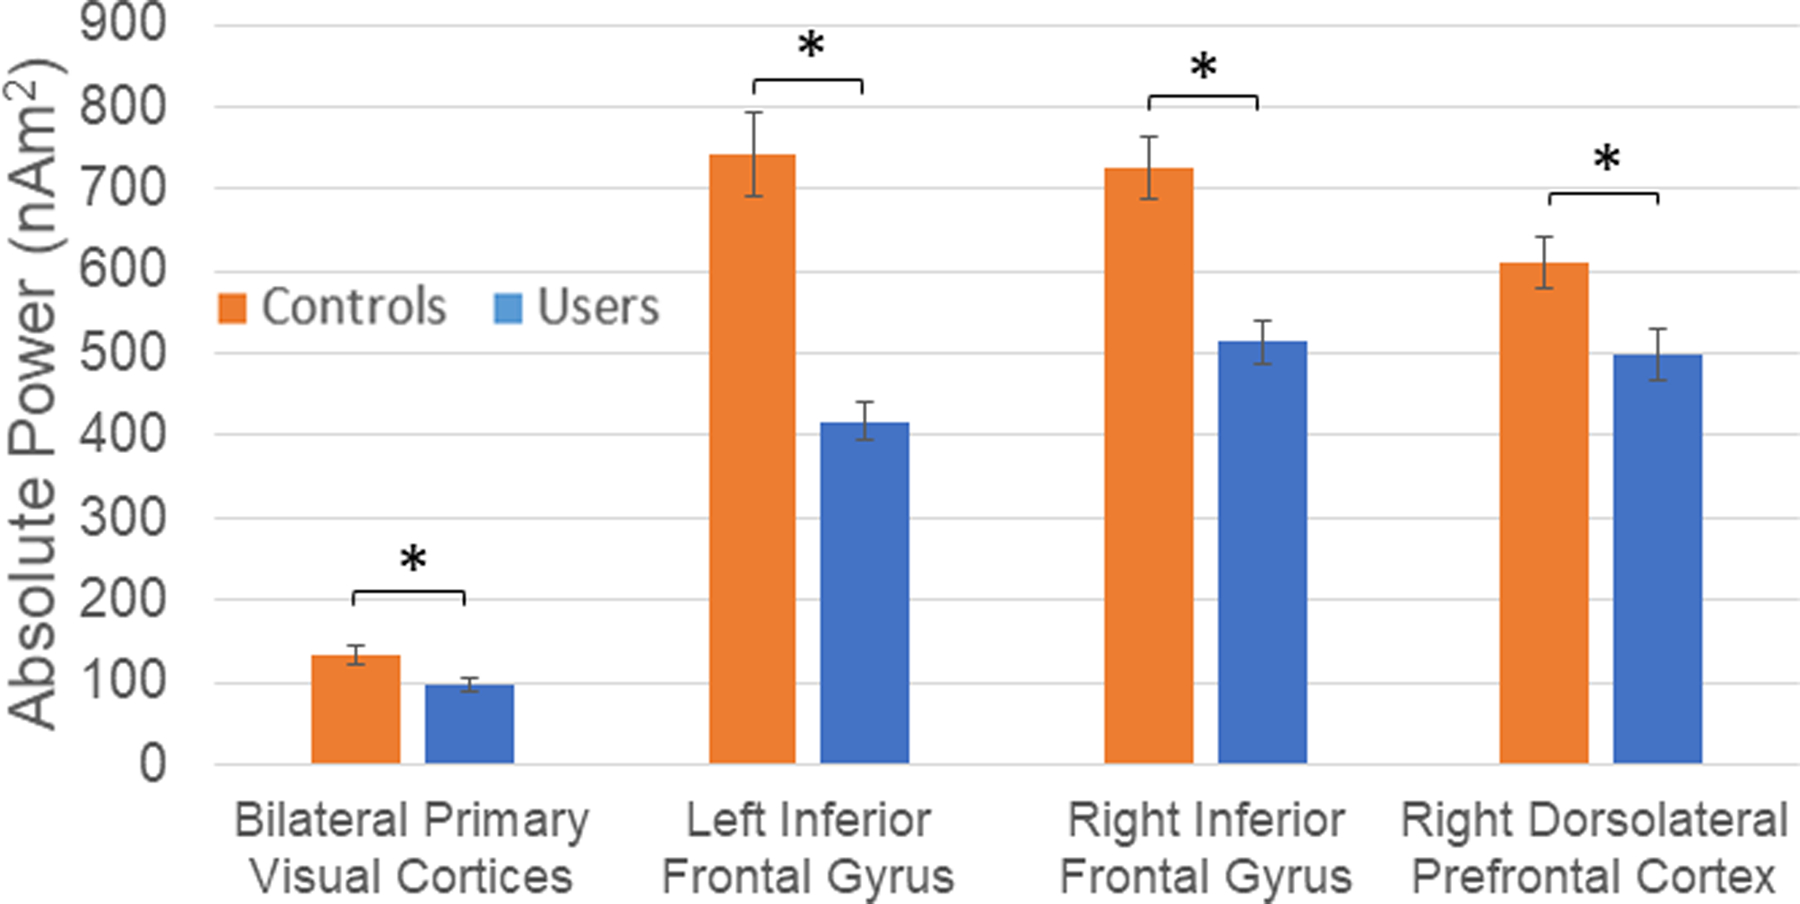
Spontaneous theta activity averaged over the baseline period (−600 to 0 ms) is shown for each spatially-defined peak in our beamformer analysis. Basal theta power was significantly reduced in all regions in chronic cannabis users compared to non-user controls. Asterisks mark significant baseline differences between groups (p < .05), with error bars reflecting SEM.
Discussion
We used a modified Posner cueing paradigm and MEG to investigate the oscillatory dynamics underlying attentional reorientation in cannabis users and nonusers, and observed robust multispectral modulation of dorsal and ventral attention networks (DAN and VAN, respectively) during attentional reallocation. Importantly, our study was the first to demonstrate cannabis-related changes in task-induced neural oscillations in brain regions known to be critical for attention function. Below, these findings and their implications are discussed further.
Behaviorally, we observed a group-independent RT validity effect such that participants were slower to respond to invalid trails relative to valid trials. This RT cost associated with attention reorientation has been well documented in the Posner cueing paradigm (Posner, 1980; Posner, 2016). Interestingly, there were no group differences or group-by-cue validity interactions in RT or accuracy. These findings show that regular cannabis users in our study were able to perform at the same level as non-users on the Posner cueing task. Some studies (Bosker et al., 2013; Dougherty et al., 2013; Huijbregts et al., 2014; Messinis et al., 2006; Thames et al., 2014) have shown that chronic cannabis users perform worse than non-users while others (Hooper et al., 2014; Verdejo-García et al., 2013) have shown that both groups perform at the same level. Previously, this relationship between task performance and behavioral outcomes has been found to be task-dependent and influenced by the length of time since last using cannabis, such that, as the abstinence period increases, behavioral defects become less robust or even insignificant (Fried et al., 2005; Hanson et al., 2010; Lovell et al., 2019; Roten et al., 2015; Scott et al., 2018). Considering the short abstinence period (i.e., no use on the day of examination) used in the current study, the lack of behavioral differences between users and controls shows that our task was relatively easy (i.e., 98.1% accuracy across group and condition), which was by design, and that any deficits in attention reorientation associated with regular cannabis use, at least as measured by the Posner cueing paradigm, were able to be internally overcome by users through neural compensatory mechanisms.
Recently, MEG analyses have specifically implicated IFG theta-band responses to be a key ventral network mediator involved in shifting the current attentional set to a new location (Proskovec et al., 2018; Spooner et al., 2020). In the current study, significant cue-validity-by-group interactions were found in the bilateral IFG, such that, regular cannabis users exhibited significantly stronger theta responses during invalidly-cued trials relative to validly-cued ones compared to controls. Considering the importance of the prefrontal cortices in the reorientation of attention, it seems that regular cannabis users allocated greater neural resources to achieve the same level of attention reorientation as their non-user counterparts. Similarly, cue validity-by-group interactions approached significance (p = .0502) for theta responses in the bilateral primary visual cortices, and were significant for beta oscillations in the bilateral LOG. In both cases, the interactions were such that regular cannabis users had larger validity effects compared to non-users, although the directionality was reversed such that cannabis users had stronger theta oscillations in the IFG during invalid relative to valid trials and stronger beta LOG responses to valid relative to invalid trials compared to controls. The theta-band synchronization that was observed in the bilateral primary visual cortices is generally believed to reflect the initial encoding of visual stimuli (Fries, 2015; Landau & Fries, 2012), while the alpha- and beta-band desynchronization observed in the bilateral extrastriate regions have been associated with the detection of specific stimulus properties (e.g., shape, color, and location) (Klimesch, 2012; Neuper & Pfurtscheller, 2001; Proskovec et al., 2018). Group differences in the strength of theta oscillations in the primary visual and IFG during invalidly- vs. validly-cued trials may reflect the dissemination of greater processing resources during invalid trials in regular users of cannabis. In regard to the stronger beta oscillations in the LOG during valid trials, this appeared to reflect both stronger and earlier responses during valid trials in cannabis users, with similar responses to invalid trials across groups.
In agreement with our findings, several studies in the domains of attention and working memory have found that, though neural differences existed between cannabis users and controls, there were no task-based behavioral differences between the groups (Chang, 2006; Eldreth et al., 2004; Jager et al., 2006; Kanayama et al., 2004). These results suggest that, at least in relatively easy tasks, cannabis users may be able to compensate to maintain the same level of task performance as their non-user peers, and our MEG findings provide at least some support for this contention. Such compensatory neural responses have been observed during task performance in the form of greater BOLD signal amplitude or duration in fMRI and/or the recruitment of neighboring cortical regions (Chang, 2006; Eldreth et al., 2004; Jager et al., 2006; Kanayama et al., 2004).
Another major finding of the current study was that regular cannabis use affected spontaneous cortical activity in attention-related brain regions. Previous work suggests that spontaneous neural activity prior to stimulus onset is modulated by healthy aging and disease-related processes (e.g., HIV-infection) (Heinrichs-Graham & Wilson, 2016; Lew et al., 2018; Rossiter et al., 2014; Spooner et al., 2018; Spooner et al., 2019; Wiesman et al., 2018). In the current study, we found significant decreases in pre-stimulus theta power in the bilateral primary visual cortices, bilateral IFG, and right dlPFC in regular cannabis users relative to controls, while pre-stimulus alpha and beta activity was unaffected by cannabis use. In regard to mechanism, in vivo and in vitro animal studies have demonstrated that CB1Rs on GABAergic interneurons in the cerebral cortex and hippocampus, which are regulated by the endocannabinoid system, mediate theta- and gamma-band (30–80 Hz) oscillations (Hajos et al., 2008; Hajos et al., 2000; Katona et al., 1999; Morgan et al., 2008; Robbe et al., 2006; Skosnik et al., 2012). The disruption of GABAergic interneurons by exogenous CB1R agonists (e.g., THC) is thought to mediate decreased baseline theta and gamma power in cannabis users (Skosnik et al., 2016; Skosnik et al., 2012). Specifically, such decreased pre-stimulus theta power has been demonstrated in both acute cannabis use (Böcker et al., 2010; Ilan et al., 2004) and in abstinent regular users (Herning et al., 2003). As such, it is not surprising that theta band spontaneous activity was found to be disrupted in our study of regular cannabis users. Furthermore, the chronic administration of CB1R agonists (e.g., THC) has been shown to cause a dramatic down-regulation and desensitization of CB1 receptors throughout the brain (Bonnet & Preuss, 2017; Sim-Selley, 2003). Studies suggest that it takes about one month of abstinence for CB1R binding to normalize, and this timeframe roughly corresponds to the duration of cannabis withdrawal syndrome (CWS; (Bonnet & Preuss, 2017)). Interestingly, an EEG study by Herning et al. (2003) found that decreased resting state theta power in regular cannabis users persisted for 28 days of monitored abstinence. Taken together, we believe that the decreased spontaneous theta power observed in regular cannabis users is likely related to disruption of GABAergic interneurons by exogenous CB1R agonists and CB1R habituation (i.e., down-regulation and desensitization).
Before concluding, it is important to note the limitations of this study. First, each cannabis user in our study consumed their own cannabis day-to-day, and thus there were likely individual differences in the potency (i.e., concentration of cannabinoids), route of administration (e.g., smoke, dab, edible consumption, etc.), and composition (i.e., relative amounts of THC and CBD) of the consumed cannabis. These differences may be important because CBD may offset some of the effects of THC (Bloomfield et al., 2019) and minimize the harm (Weinstein et al., 2016). Second, there were differences in the duration of cannabis use in our sample and the impact of such duration differences is unknown. Future studies should directly focus on the impact of duration and potency. Third, the current study utilized relatively small sample sizes and future studies would benefit from including more participants. Additionally, nicotine and caffeine consumption were not directly controlled for in the current study. Finally, all of the cannabis users in our study were recreational users and thus our findings may not extend to medicinal users or those who use for both purposes.
To close, the current study was the first to investigate alterations in the neural oscillatory activity underlying attentional reorienting in regular, recreational cannabis users. Briefly, we found that cannabis users had significantly altered oscillatory dynamics in key regions of the DAN and VAN during attentional reallocation relative to controls, as well as altered spontaneous theta in some of the same brain regions. Some of these oscillatory differences may serve a compensatory role and help users to maintain adequate performance. Future studies should further investigate the nature of such neural oscillatory differences and their role in maintaining task performance. Considering the regulatory shifts in the United States and other countries relating to the legality of cannabis use, it is becoming increasingly important that the effects of regular cannabis use are more thoroughly understood, and consequently further research on the cognitive and physiological effects are seriously needed.
Supplementary Material
Figure S2. To ensure that our theta-band validity effect findings in the bilateral inferior frontal gyri (IFG) were not related to artifacts from saccadic eye movements, we time domain averaged the artifact-corrected data separately by condition (i.e., valid and invalid) and direction of target presentation (i.e., left or right). Prior to averaging (in the main analyses and this supplemental analysis), we removed eye-related artifacts (e.g., blinks and saccadic eye movements) and cardiac artifacts using signal-space projection (SSP). Trials were then rejected based on high amplitude and gradient values and the remaining trials were time domain averaged in this supplemental analysis. The time domain averages per condition and side of target for four participants, chosen based on high invalid-valid pseudo-t values in the IFG (shown in the bar graphs), are shown above. Additionally, for each participant, we show the entire gradiometer array with enlarged views of the two frontal gradiometers that typically show the largest ocular artifacts. For each time series plot, time is shown on the x-axis in ms while amplitude is shown on the y-axis in femtoTesla/cm (fT/cm). Since saccadic ocular movements are largely recorded as low frequency signals, the time series data have been filtered using a 20 Hz low-pass filter. The darker yellow boxes highlighted the temporal window used for imaging the prefrontal theta-band activity (i.e., 350–700 ms). For the two sensors of interest (i.e., 0312 and 1212), data was averaged separately for target left and target right conditions, and in each we have overlaid the invalid (i.e., saccade) and valid (i.e., no saccade) trials. As such, if ocular artifacts remained in the data following SSP removal, one would expect there to be significant activity in the invalid condition that is not present in the valid condition. The data was plotted with the left and right target conditions separately because it is expected that the polarity of the artifact would differ based on the direction of the saccade, and thus averaging the two conditions could cancel each other out. In conclusion, these data show that the removal of saccadic ocular artifacts was sufficient and support the conclusion that out bilateral IFG theta-band responses were not influenced by these artifacts.
Figure S1. Alpha activity during target processing. Alpha beamformer images (inset) were computed across conditions and then averaged across all participants. The output images are shown in pseudo-t units following the neurological convention (right hemisphere on the right side). Decreases in alpha activity were observed in the following regions: (A) bilateral lateral occipital gyri, (B) left intraparietal sulcus, and (C) right intraparietal sulcus. Time courses (i.e., line graphs) of alpha activity from the peak voxel (i.e., yellow dot on beamformer images) in each region were averaged over the beamforming window (i.e., 300–900 ms; gray box) and the difference was calculated across conditions (i.e., invalid – valid) to determine the neural validity effect (bar graphs). Asterisks mark significant neural validity effects (p < .05), with error bars reflecting SEM. No group differences were observed for alpha responses. The inset showing occipital responses is in units of pseudo-t values scaled from 12.0 to 20.0 while the other insets are scaled from 10.0 to 20.0.
Acknowledgements and Funding Support
This study was supported by the National Institutes of Health through grants R01-DA047828 (TWW), R03-DA041917 (TWW), R01-MH103220 (TWW), R01-MH116782 (TWW), and R01-MH118013 (TWW). The funders had no role in the study design, collection, analysis, or interpretation of data, nor did they influence writing the report or the decision to submit this work for publication. The data presented in this manuscript have not been published or presented elsewhere.
Footnotes
Conflicts of Interest
None of the authors report any competing financial or other interests.
The authors assert that all procedures contributing to this work comply with the ethical standards of the relevant national and institutional committees on human experimentation and with the Helsinki Declaration of 1975, as revised in 2008.
References:
- Arif Y, Spooner RK, Wiesman AI, Embury CM, Proskovec AL, & Wilson TW (2020). Modulation of attention networks serving reorientation in healthy aging. Aging. 10.18632/aging.103515 [DOI] [PMC free article] [PubMed] [Google Scholar]
- Arif Y, Wiesman AI, O’Neill J, Embury C, May PE, Lew BJ, Schantell MD, Fox HS, Swindells S, & Wilson TW (2020). The age-related trajectory of visual attention neural function is altered in adults living with HIV: A cross-sectional MEG study. EBioMedicine, 61, 103065. 10.1016/j.ebiom.2020.103065 [DOI] [PMC free article] [PubMed] [Google Scholar]
- Azofeifa A, Mattson ME, Schauer G, McAfee T, Grant A, & Lyerla R (2016). National Estimates of Marijuana Use and Related Indicators — National Survey on Drug Use and Health, United States, 2002–2014. MMWR. Surveillance Summaries, 65(11), 1–28. 10.15585/mmwr.ss6511a1 [DOI] [PubMed] [Google Scholar]
- Block RI, O’Leary DS, Ehrhardt JC, Augustinack JC, Ghoneim MM, Arndt S, & Hall JA (2000). Effects of frequent marijuana use on brain tissue volume and composition. Neuroreport, 11(3), 491–496. 10.1097/00001756-200002280-00013 [DOI] [PubMed] [Google Scholar]
- Bloomfield MAP, Hindocha C, Green SF, Wall MB, Lees R, Petrilli K, Costello H, Ogunbiyi MO, Bossong MG, & Freeman TP (2019). The neuropsychopharmacology of cannabis: A review of human imaging studies. Pharmacology & Therapeutics, 195, 132–161. 10.1016/j.pharmthera.2018.10.006 [DOI] [PMC free article] [PubMed] [Google Scholar]
- Böcker KB, Hunault CC, Gerritsen J, Kruidenier M, Mensinga TT, & Kenemans JL (2010). Cannabinoid modulations of resting state EEG θ power and working memory are correlated in humans. J Cogn Neurosci, 22(9), 1906–1916. 10.1162/jocn.2009.21355 [DOI] [PubMed] [Google Scholar]
- Bonnet U, & Preuss U (2017). The cannabis withdrawal syndrome: current insights. Substance Abuse and Rehabilitation, Volume 8, 9–37. 10.2147/sar.s109576 [DOI] [PMC free article] [PubMed] [Google Scholar]
- Bosker WM, Karschner EL, Lee D, Goodwin RS, Hirvonen J, Innis RB, Theunissen EL, Kuypers KPC, Huestis MA, & Ramaekers JG (2013). Psychomotor Function in Chronic Daily Cannabis Smokers during Sustained Abstinence. PLoS One, 8(1), e53127. 10.1371/journal.pone.0053127 [DOI] [PMC free article] [PubMed] [Google Scholar]
- Broyd SJ, van Hell HH, Beale C, Yucel M, & Solowij N (2016). Acute and Chronic Effects of Cannabinoids on Human Cognition-A Systematic Review. Biol Psychiatry, 79(7), 557–567. 10.1016/j.biopsych.2015.12.002 [DOI] [PubMed] [Google Scholar]
- Carliner H, Brown QL, Sarvet AL, & Hasin DS (2017). Cannabis use, attitudes, and legal status in the U.S.: A review. Preventive Medicine, 104, 13–23. 10.1016/j.ypmed.2017.07.008 [DOI] [PMC free article] [PubMed] [Google Scholar]
- Chang L (2006). Marijuana use is associated with a reorganized visual-attention network and cerebellar hypoactivation. 129(5), 1096–1112. 10.1093/brain/awl064 [DOI] [PubMed] [Google Scholar]
- Chica AB, Bartolomeo P, & Lupiáñez J (2013). Two cognitive and neural systems for endogenous and exogenous spatial attention. 237, 107–123. 10.1016/j.bbr.2012.09.027 [DOI] [PubMed] [Google Scholar]
- Cohen K, & Weinstein A (2018). The Effects of Cannabinoids on Executive Functions: Evidence from Cannabis and Synthetic Cannabinoids—A Systematic Review. Brain Sciences, 8(3), 40. 10.3390/brainsci8030040 [DOI] [PMC free article] [PubMed] [Google Scholar]
- Corbetta M, Patel G, & Shulman GL (2008). The reorienting system of the human brain: from environment to theory of mind. Neuron, 58(3), 306–324. 10.1016/j.neuron.2008.04.017 [DOI] [PMC free article] [PubMed] [Google Scholar]
- Corbetta M, & Shulman GL (2002). Control of goal-directed and stimulus-driven attention in the brain. Nature Reviews Neuroscience, 3(3), 201–215. 10.1038/nrn755 [DOI] [PubMed] [Google Scholar]
- Daitch AL, Sharma M, Roland JL, Astafiev SV, Bundy DT, Gaona CM, Snyder AZ, Shulman GL, Leuthardt EC, & Corbetta M (2013). Frequency-specific mechanism links human brain networks for spatial attention. Proc Natl Acad Sci U S A, 110(48), 19585–19590. 10.1073/pnas.1307947110 [DOI] [PMC free article] [PubMed] [Google Scholar]
- Dougherty DM, Mathias CW, Dawes MA, Furr RM, Charles NE, Liguori A, Shannon EE, & Acheson A (2013). Impulsivity, attention, memory, and decision-making among adolescent marijuana users. Psychopharmacology, 226(2), 307–319. 10.1007/s00213-012-2908-5 [DOI] [PMC free article] [PubMed] [Google Scholar]
- Eldreth DA, Matochik JA, Cadet JL, & Bolla KI (2004). Abnormal brain activity in prefrontal brain regions in abstinent marijuana users. 23(3), 914–920. 10.1016/j.neuroimage.2004.07.032 [DOI] [PubMed] [Google Scholar]
- Fried PA, Watkinson B, & Gray R (2005). Neurocognitive consequences of marihuana--a comparison with pre-drug performance. Neurotoxicol Teratol, 27(2), 231–239. 10.1016/j.ntt.2004.11.003 [DOI] [PubMed] [Google Scholar]
- Fries P (2015). Rhythms for Cognition: Communication through Coherence. Neuron, 88(1), 220–235. 10.1016/j.neuron.2015.09.034 [DOI] [PMC free article] [PubMed] [Google Scholar]
- Ganzer F, Bröning S, Kraft S, Sack P-M, & Thomasius R (2016). Weighing the Evidence: A Systematic Review on Long-Term Neurocognitive Effects of Cannabis Use in Abstinent Adolescents and Adults. Neuropsychology Review, 26(2), 186–222. 10.1007/s11065-016-9316-2 [DOI] [PubMed] [Google Scholar]
- Gilman JM, Yucel MA, Pachas GN, Potter K, Levar N, Broos H, Manghis EM, Schuster RM, & Evins AE (2019). Delta-9-tetrahydrocannabinol intoxication is associated with increased prefrontal activation as assessed with functional near-infrared spectroscopy: A report of a potential biomarker of intoxication. Neuroimage, 197, 575–585. 10.1016/j.neuroimage.2019.05.012 [DOI] [PMC free article] [PubMed] [Google Scholar]
- Gross J, Kujala J, Hamalainen M, Timmermann L, Schnitzler A, & Salmelin R (2001). Dynamic imaging of coherent sources: Studying neural interactions in the human brain. Proc Natl Acad Sci U S A, 98(2), 694–699. 10.1073/pnas.98.2.694 [DOI] [PMC free article] [PubMed] [Google Scholar]
- Hajos M, Hoffmann WE, & Kocsis B (2008). Activation of cannabinoid-1 receptors disrupts sensory gating and neuronal oscillation: relevance to schizophrenia. Biol Psychiatry, 63(11), 1075–1083. 10.1016/j.biopsych.2007.12.005 [DOI] [PubMed] [Google Scholar]
- Hajos N, Katona I, Naiem SS, MacKie K, Ledent C, Mody I, & Freund TF (2000). Cannabinoids inhibit hippocampal GABAergic transmission and network oscillations. Eur J Neurosci, 12(9), 3239–3249. 10.1046/j.1460-9568.2000.00217.x [DOI] [PubMed] [Google Scholar]
- Hanson KL, Winward JL, Schweinsburg AD, Medina KL, Brown SA, & Tapert SF (2010). Longitudinal study of cognition among adolescent marijuana users over three weeks of abstinence. Addictive Behaviors, 35(11), 970–976. 10.1016/j.addbeh.2010.06.012 [DOI] [PMC free article] [PubMed] [Google Scholar]
- Heinrichs-Graham E, Arpin DJ, & Wilson TW (2016). Cue-related Temporal Factors Modulate Movement-related Beta Oscillatory Activity in the Human Motor Circuit. J Cogn Neurosci, 28(7), 1039–1051. 10.1162/jocn_a_00948 [DOI] [PMC free article] [PubMed] [Google Scholar]
- Heinrichs-Graham E, Kurz MJ, Gehringer JE, & Wilson TW (2017). The functional role of post-movement beta oscillations in motor termination. Brain Struct Funct, 222(7), 3075–3086. 10.1007/s00429-017-1387-1 [DOI] [PMC free article] [PubMed] [Google Scholar]
- Heinrichs-Graham E, & Wilson TW (2015). Coding complexity in the human motor circuit. Hum Brain Mapp, 36(12), 5155–5167. 10.1002/hbm.23000 [DOI] [PMC free article] [PubMed] [Google Scholar]
- Heinrichs-Graham E, & Wilson TW (2016). Is an absolute level of cortical beta suppression required for proper movement? Magnetoencephalographic evidence from healthy aging. Neuroimage, 134, 514–521. 10.1016/j.neuroimage.2016.04.032 [DOI] [PMC free article] [PubMed] [Google Scholar]
- Herning RI, Better W, Tate K, & Cadet JL (2003). EEG deficits in chronic marijuana abusers during monitored abstinence: preliminary findings. Ann N Y Acad Sci, 993, 75–78; discussion 79–81. 10.1111/j.1749-6632.2003.tb07513.x [DOI] [PubMed] [Google Scholar]
- Hillebrand A, Singh KD, Holliday IE, Furlong PL, & Barnes GR (2005). A new approach to neuroimaging with magnetoencephalography. Hum Brain Mapp, 25(2), 199–211. 10.1002/hbm.20102 [DOI] [PMC free article] [PubMed] [Google Scholar]
- Hooper SR, Woolley D, & De Bellis MD (2014). Intellectual, neurocognitive, and academic achievement in abstinent adolescents with cannabis use disorder. Psychopharmacology, 231(8), 1467–1477. 10.1007/s00213-014-3463-z [DOI] [PMC free article] [PubMed] [Google Scholar]
- Huijbregts SCJ, Griffith-Lendering MFH, Vollebergh WAM, & Swaab H (2014). Neurocognitive moderation of associations between cannabis use and psychoneuroticism. 36(8), 794–805. 10.1080/13803395.2014.943694 [DOI] [PubMed] [Google Scholar]
- Ilan AB, Smith ME, & Gevins A (2004). Effects of marijuana on neurophysiological signals of working and episodic memory. Psychopharmacology (Berl), 176(2), 214–222. 10.1007/s00213-004-1868-9 [DOI] [PMC free article] [PubMed] [Google Scholar]
- Jager G, Kahn RS, Van Den Brink W, Van Ree JM, & Ramsey NF (2006). Long-term effects of frequent cannabis use on working memory and attention: an fMRI study. 185(3), 358–368. 10.1007/s00213-005-0298-7 [DOI] [PubMed] [Google Scholar]
- Jager G, Van Hell HH, De Win MM, Kahn RS, Van Den Brink W, Van Ree JM, & Ramsey NF (2007). Effects of frequent cannabis use on hippocampal activity during an associative memory task. Eur Neuropsychopharmacol, 17(4), 289–297. 10.1016/j.euroneuro.2006.10.003 [DOI] [PubMed] [Google Scholar]
- Kanayama G, Rogowska J, Pope HG, Gruber SA, & Yurgelun-Todd DA (2004). Spatial working memory in heavy cannabis users: a functional magnetic resonance imaging study. Psychopharmacology (Berl), 176(3–4), 239–247. 10.1007/s00213-004-1885-8 [DOI] [PubMed] [Google Scholar]
- Katona I, Sperlagh B, Sik A, Kafalvi A, Vizi ES, Mackie K, & Freund TF (1999). Presynaptically located CB1 cannabinoid receptors regulate GABA release from axon terminals of specific hippocampal interneurons. J Neurosci, 19(11), 4544–4558. 10.1523/JNEUROSCI.19-11-04544.1999 [DOI] [PMC free article] [PubMed] [Google Scholar]
- Klimesch W (2012). alpha-band oscillations, attention, and controlled access to stored information. Trends Cogn Sci, 16(12), 606–617. 10.1016/j.tics.2012.10.007 [DOI] [PMC free article] [PubMed] [Google Scholar]
- Kovach CK, & Gander PE (2016). The demodulated band transform. J Neurosci Methods, 261, 135–154. 10.1016/j.jneumeth.2015.12.004 [DOI] [PMC free article] [PubMed] [Google Scholar]
- Landau AN, & Fries P (2012). Attention samples stimuli rhythmically. Curr Biol, 22(11), 1000–1004. 10.1016/j.cub.2012.03.054 [DOI] [PubMed] [Google Scholar]
- Lew BJ, McDermott TJ, Wiesman AI, O’Neill J, Mills MS, Robertson KR, Fox HS, Swindells S, & Wilson TW (2018). Neural dynamics of selective attention deficits in HIV-associated neurocognitive disorder. Neurology, 91(20), e1860–e1869. 10.1212/WNL.0000000000006504 [DOI] [PMC free article] [PubMed] [Google Scholar]
- Lopez-Larson MP, Rogowska J, & Yurgelun-Todd D (2015). Aberrant orbitofrontal connectivity in marijuana smoking adolescents. Developmental Cognitive Neuroscience, 16, 54–62. 10.1016/j.dcn.2015.08.002 [DOI] [PMC free article] [PubMed] [Google Scholar]
- Lovell ME, Akhurst J, Padgett C, Garry MI, & Matthews A (2019). Cognitive outcomes associated with long-term, regular, recreational cannabis use in adults: A meta-analysis. Exp Clin Psychopharmacol. 10.1037/pha0000326 [DOI] [PubMed] [Google Scholar]
- Macaluso E, & Patria F (2007). Spatial re-orienting of visual attention along the horizontal or the vertical axis. 180(1), 23–34. 10.1007/s00221-006-0841-8 [DOI] [PubMed] [Google Scholar]
- Messinis L, Kyprianidou A, Malefaki S, & Papathanasopoulos P (2006). Neuropsychological deficits in long-term frequent cannabis users. 66(5), 737–739. 10.1212/01.wnl.0000201279.83203.c6 [DOI] [PubMed] [Google Scholar]
- Morgan NH, Stanford IM, & Woodhall GL (2008). Modulation of network oscillatory activity and GABAergic synaptic transmission by CB1 cannabinoid receptors in the rat medial entorhinal cortex. Neural Plast, 2008, 808564. 10.1155/2008/808564 [DOI] [PMC free article] [PubMed] [Google Scholar]
- Neuper C, & Pfurtscheller G (2001). Event-related dynamics of cortical rhythms: frequency-specific features and functional correlates. Int J Psychophysiol, 43(1), 41–58. 10.1016/s0167-8760(01)00178-7 [DOI] [PubMed] [Google Scholar]
- Posner MI (1980). Orienting of attention. Q J Exp Psychol, 32(1), 3–25. 10.1080/00335558008248231 [DOI] [PubMed] [Google Scholar]
- Posner MI (2016). Orienting of Attention: Then and Now. Quarterly Journal of Experimental Psychology, 69(10), 1864–1875. 10.1080/17470218.2014.937446 [DOI] [PMC free article] [PubMed] [Google Scholar]
- Proskovec AL, Heinrichs-Graham E, Wiesman AI, McDermott TJ, & Wilson TW (2018). Oscillatory dynamics in the dorsal and ventral attention networks during the reorienting of attention. Hum Brain Mapp, 39(5), 2177–2190. 10.1002/hbm.23997 [DOI] [PMC free article] [PubMed] [Google Scholar]
- Robbe D, Montgomery SM, Thome A, Rueda-Orozco PE, McNaughton BL, & Buzsaki G (2006). Cannabinoids reveal importance of spike timing coordination in hippocampal function. Nat Neurosci, 9(12), 1526–1533. 10.1038/nn1801 [DOI] [PubMed] [Google Scholar]
- Rossiter HE, Davis EM, Clark EV, Boudrias MH, & Ward NS (2014). Beta oscillations reflect changes in motor cortex inhibition in healthy ageing. Neuroimage, 91, 360–365. 10.1016/j.neuroimage.2014.01.012 [DOI] [PMC free article] [PubMed] [Google Scholar]
- Roten A, Baker NL, & Gray KM (2015). Cognitive performance in a placebo-controlled pharmacotherapy trial for youth with marijuana dependence. 45, 119–123. 10.1016/j.addbeh.2015.01.013 [DOI] [PMC free article] [PubMed] [Google Scholar]
- SAMHSA. (2017). Key Substance Use and Mental Health Indicators in the United States: Results from the 2016 National Survey on Drug Use and Health. Rockville, MD: Center for Behavioral Health Statistics and Quality, Substance Abuse and Mental Health Services Administration; Retrieved from https://www.samhsa.gov/data/ [Google Scholar]
- Schreiner AM, & Dunn ME (2012). Residual effects of cannabis use on neurocognitive performance after prolonged abstinence: a meta-analysis. Exp Clin Psychopharmacol, 20(5), 420–429. 10.1037/a0029117 [DOI] [PubMed] [Google Scholar]
- Schweinsburg AD, Nagel BJ, Schweinsburg BC, Park A, Theilmann RJ, & Tapert SF (2008). Abstinent adolescent marijuana users show altered fMRI response during spatial working memory. Psychiatry Res, 163(1), 40–51. 10.1016/j.pscychresns.2007.04.018 [DOI] [PMC free article] [PubMed] [Google Scholar]
- Scott JC, Slomiak ST, Jones JD, Rosen AFG, Moore TM, & Gur RC (2018). Association of Cannabis With Cognitive Functioning in Adolescents and Young Adults. JAMA Psychiatry, 75(6), 585. 10.1001/jamapsychiatry.2018.0335 [DOI] [PMC free article] [PubMed] [Google Scholar]
- Sim-Selley LJ (2003). Regulation of cannabinoid CB1 receptors in the central nervous system by chronic cannabinoids. Crit Rev Neurobiol, 15(2), 91–119. 10.1615/critrevneurobiol.v15.i2.10 [DOI] [PubMed] [Google Scholar]
- Skosnik PD, Cortes-Briones JA, & Hajós M (2016). It’s All in the Rhythm: The Role of Cannabinoids in Neural Oscillations and Psychosis. Biol Psychiatry, 79(7), 568–577. 10.1016/j.biopsych.2015.12.011 [DOI] [PubMed] [Google Scholar]
- Skosnik PD, D’Souza DC, Steinmetz AB, Edwards CR, Vollmer JM, Hetrick WP, & O’Donnell BF (2012). The effect of chronic cannabinoids on broadband EEG neural oscillations in humans. Neuropsychopharmacology, 37(10), 2184–2193. 10.1038/npp.2012.65 [DOI] [PMC free article] [PubMed] [Google Scholar]
- Spooner RK, Wiesman AI, Mills MS, O’Neill J, Robertson KR, Fox HS, Swindells S, & Wilson TW (2018). Aberrant oscillatory dynamics during somatosensory processing in HIV-infected adults. Neuroimage Clin, 20, 85–91. 10.1016/j.nicl.2018.07.009 [DOI] [PMC free article] [PubMed] [Google Scholar]
- Spooner RK, Wiesman AI, Proskovec AL, Heinrichs-Graham E, & Wilson TW (2019). Rhythmic Spontaneous Activity Mediates the Age-Related Decline in Somatosensory Function. Cereb Cortex, 29(2), 680–688. 10.1093/cercor/bhx349 [DOI] [PMC free article] [PubMed] [Google Scholar]
- Spooner RK, Wiesman AI, Proskovec AL, Heinrichs-Graham E, & Wilson TW (2020). Prefrontal theta modulates sensorimotor gamma networks during the reorienting of attention. Human Brain Mapping, 41(2), 520–529. 10.1002/hbm.24819 [DOI] [PMC free article] [PubMed] [Google Scholar]
- Taulu S, Kajola M, & Simola J (2004). Suppression of interference and artifacts by the Signal Space Separation Method. Brain Topogr, 16(4), 269–275. 10.1023/b:brat.0000032864.93890.f9 [DOI] [PubMed] [Google Scholar]
- Taulu S, & Simola J (2006). Spatiotemporal signal space separation method for rejecting nearby interference in MEG measurements. Phys Med Biol, 51(7), 1759–1768. 10.1088/0031-9155/51/7/008 [DOI] [PubMed] [Google Scholar]
- Thames AD, Arbid N, & Sayegh P (2014). Cannabis use and neurocognitive functioning in a non-clinical sample of users. 39(5), 994–999. 10.1016/j.addbeh.2014.01.019 [DOI] [PMC free article] [PubMed] [Google Scholar]
- Thiel CM, Zilles K, & Fink GR (2004). Cerebral correlates of alerting, orienting and reorienting of visuospatial attention: an event-related fMRI study. 21(1), 318–328. 10.1016/j.neuroimage.2003.08.044 [DOI] [PubMed] [Google Scholar]
- Tzilos GK, Cintron CB, Wood JB, Simpson NS, Young AD, Pope HG Jr., & Yurgelun-Todd DA (2005). Lack of hippocampal volume change in long-term heavy cannabis users. Am J Addict, 14(1), 64–72. 10.1080/10550490590899862 [DOI] [PubMed] [Google Scholar]
- Verdejo-García A, Beatriz Fagundo A, Cuenca A, Rodriguez J, Cuyás E, Langohr K, De Sola Llopis S, Civit E, Farré M, Peña-Casanova J, & De La Torre R (2013). COMT val158met and 5-HTTLPR Genetic Polymorphisms Moderate Executive Control in Cannabis Users. 38(8), 1598–1606. 10.1038/npp.2013.59 [DOI] [PMC free article] [PubMed] [Google Scholar]
- Vossel S, Thiel CM, & Fink GR (2006). Cue validity modulates the neural correlates of covert endogenous orienting of attention in parietal and frontal cortex. Neuroimage, 32(3), 1257–1264. 10.1016/j.neuroimage.2006.05.019 [DOI] [PubMed] [Google Scholar]
- Vossel S, Weidner R, Driver J, Friston KJ, & Fink GR (2012). Deconstructing the architecture of dorsal and ventral attention systems with dynamic causal modeling. J Neurosci, 32(31), 10637–10648. 10.1523/JNEUROSCI.0414-12.2012 [DOI] [PMC free article] [PubMed] [Google Scholar]
- Weinstein A, Livny A, & Weizman A (2016). Brain Imaging Studies on the Cognitive, Pharmacological and Neurobiological Effects of Cannabis in Humans: Evidence from Studies of Adult Users. Curr Pharm Des, 22(42), 6366–6379. 10.2174/1381612822666160822151323 [DOI] [PubMed] [Google Scholar]
- Wiesman AI, Groff BR, & Wilson TW (2019). Frontoparietal Networks Mediate the Behavioral Impact of Alpha Inhibition in Visual Cortex. Cereb Cortex, 29(8), 3505–3513. 10.1093/cercor/bhy220 [DOI] [PMC free article] [PubMed] [Google Scholar]
- Wiesman AI, O’Neill J, Mills MS, Robertson KR, Fox HS, Swindells S, & Wilson TW (2018). Aberrant occipital dynamics differentiate HIV-infected patients with and without cognitive impairment. Brain, 141(6), 1678–1690. 10.1093/brain/awy097 [DOI] [PMC free article] [PubMed] [Google Scholar]
- Wiesman AI, & Wilson TW (2019). Alpha Frequency Entrainment Reduces the Effect of Visual Distractors. J Cogn Neurosci, 31(9), 1392–1403. 10.1162/jocn_a_01422 [DOI] [PMC free article] [PubMed] [Google Scholar]
- Wilson W, Mathew R, Turkington T, Hawk T, Coleman RE, & Provenzale J (2000). Brain morphological changes and early marijuana use: a magnetic resonance and positron emission tomography study. J Addict Dis, 19(1), 1–22. 10.1300/J069v19n01_01 [DOI] [PubMed] [Google Scholar]
Associated Data
This section collects any data citations, data availability statements, or supplementary materials included in this article.
Supplementary Materials
Figure S2. To ensure that our theta-band validity effect findings in the bilateral inferior frontal gyri (IFG) were not related to artifacts from saccadic eye movements, we time domain averaged the artifact-corrected data separately by condition (i.e., valid and invalid) and direction of target presentation (i.e., left or right). Prior to averaging (in the main analyses and this supplemental analysis), we removed eye-related artifacts (e.g., blinks and saccadic eye movements) and cardiac artifacts using signal-space projection (SSP). Trials were then rejected based on high amplitude and gradient values and the remaining trials were time domain averaged in this supplemental analysis. The time domain averages per condition and side of target for four participants, chosen based on high invalid-valid pseudo-t values in the IFG (shown in the bar graphs), are shown above. Additionally, for each participant, we show the entire gradiometer array with enlarged views of the two frontal gradiometers that typically show the largest ocular artifacts. For each time series plot, time is shown on the x-axis in ms while amplitude is shown on the y-axis in femtoTesla/cm (fT/cm). Since saccadic ocular movements are largely recorded as low frequency signals, the time series data have been filtered using a 20 Hz low-pass filter. The darker yellow boxes highlighted the temporal window used for imaging the prefrontal theta-band activity (i.e., 350–700 ms). For the two sensors of interest (i.e., 0312 and 1212), data was averaged separately for target left and target right conditions, and in each we have overlaid the invalid (i.e., saccade) and valid (i.e., no saccade) trials. As such, if ocular artifacts remained in the data following SSP removal, one would expect there to be significant activity in the invalid condition that is not present in the valid condition. The data was plotted with the left and right target conditions separately because it is expected that the polarity of the artifact would differ based on the direction of the saccade, and thus averaging the two conditions could cancel each other out. In conclusion, these data show that the removal of saccadic ocular artifacts was sufficient and support the conclusion that out bilateral IFG theta-band responses were not influenced by these artifacts.
Figure S1. Alpha activity during target processing. Alpha beamformer images (inset) were computed across conditions and then averaged across all participants. The output images are shown in pseudo-t units following the neurological convention (right hemisphere on the right side). Decreases in alpha activity were observed in the following regions: (A) bilateral lateral occipital gyri, (B) left intraparietal sulcus, and (C) right intraparietal sulcus. Time courses (i.e., line graphs) of alpha activity from the peak voxel (i.e., yellow dot on beamformer images) in each region were averaged over the beamforming window (i.e., 300–900 ms; gray box) and the difference was calculated across conditions (i.e., invalid – valid) to determine the neural validity effect (bar graphs). Asterisks mark significant neural validity effects (p < .05), with error bars reflecting SEM. No group differences were observed for alpha responses. The inset showing occipital responses is in units of pseudo-t values scaled from 12.0 to 20.0 while the other insets are scaled from 10.0 to 20.0.