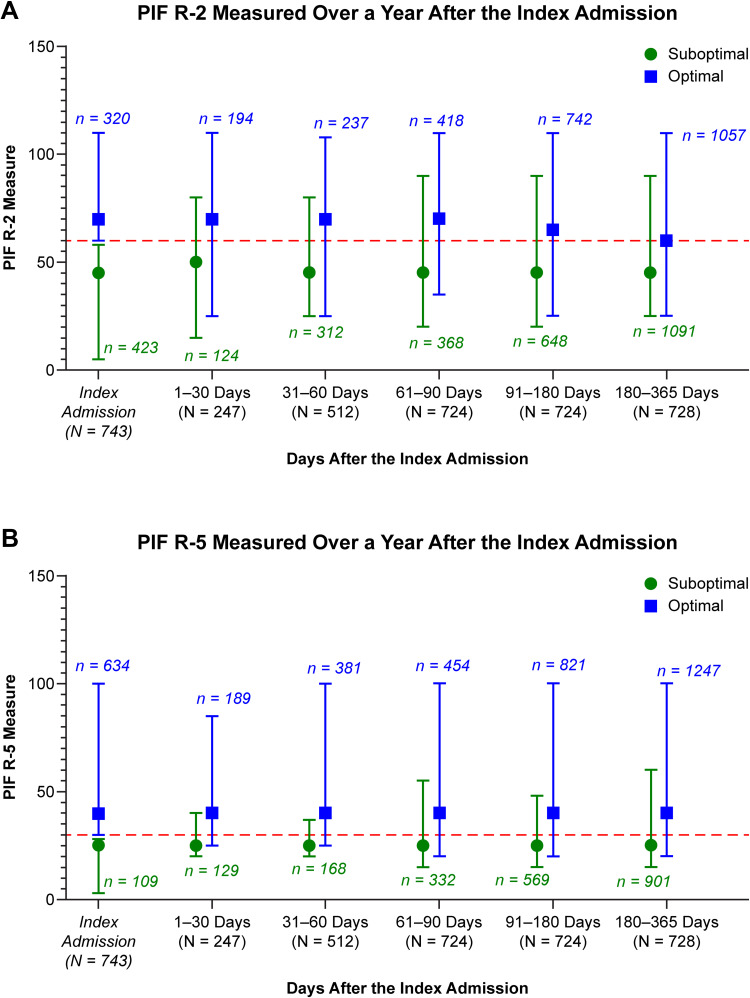
Figure 2.
Median (minimum and maximum) PIFs in the year after the index admission by index PIF group. (A) PIFR R-2 measured over a year after the index admission; (B) PIFR R-5 measured over a year after the index admission.
Note: n denotes number of PIF measurements, N denotes total number of patients at each time point.
Abbreviations: PIF, peak inspiratory flow; PIFR, PIF rate; R-2, medium-low resistance; R-5, high resistance.

