
FIGURE 3.
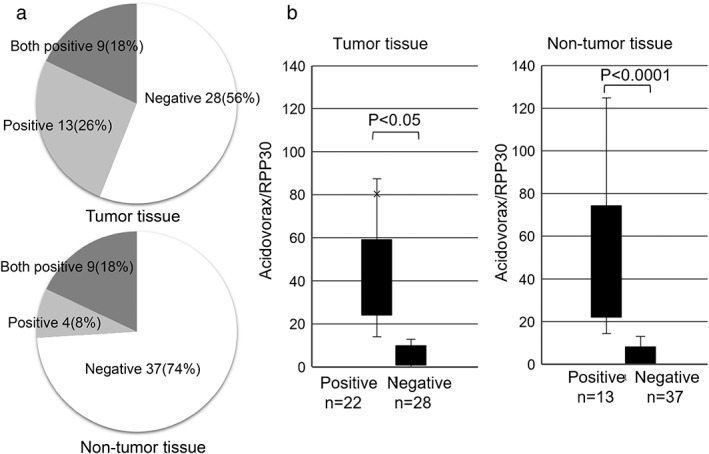
Comparison of the abundance of Acidovorax in tumor and nontumor tissues. (a) The rate of positivity for Acidovorax in tumor and nontumor tissues. (b) The ratio of Acidovorax/RPP30 abundance in tumor and nontumor tissues. The paired t‐test was used to evaluate the mean values.