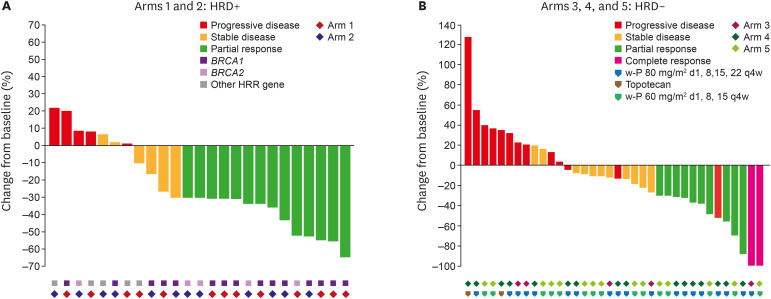
Fig. 2. Tumour responses. (A) Waterfall plot of the maximum percentage change in target lesion size in treated patients who had at least one post-baseline scan. Each bar presents a patient. The colour indicates type of response. (B) Swimmer’s plot for patients with a confirmed response. Each bar presents a patient. From 61 patients who had at least one post-baseline efficacy assessment.
d, day; HRD, homologous recombination deficiency; HRR, homologous recombination repair; q4w, every 4 weeks; w-P, weekly paclitaxel.

