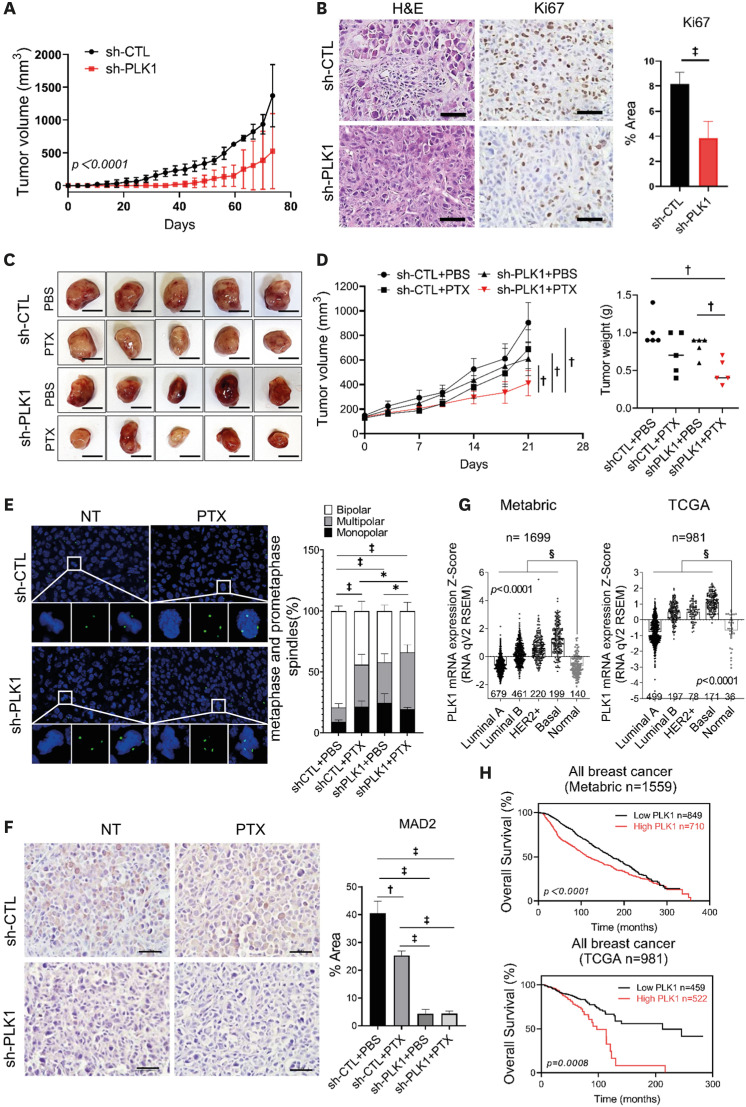
Figure 4. Increased PTX cytotoxicity after PLK1 depletion in vivo.
(A) Inhibition of tumor growth generated by xenografted MDA-MB-231 cell lines in nude mice after silencing of PLK1. Tumor growth curves are shown (n = 4 mice/group); two-way ANOVA with Turkey’s post hoc test. (B) Representative H&E and Ki-67-stained images of tumor and the expression levels of Ki-67. The area percentage was measured from 10 different images; Student’s t-tests. (C) PTX treatment of nude mice bearing MDA-MB-231 sh-CTL and sh-PLK1 xenograft tumors. Tumors removed from five mice in each group are shown. (D) Left: Measured tumor volume from days 0 to 21 after treatment plotted versus time. Right: Statistical analysis of the weights of dissected tumors (n = 5 mice/group); multiple t-testing. (E) Images of mitotic spindles with the indicated number of poles in MDA-MB-231 sh-CTL and sh-PLK1 xenograft tumors after PTX treatment. Quantification of multipolar spindles in MDA-MB-231 xenograft tumors (n > 30 cells/mice); Mann–Whitney U test. (F) Representative images of MAD2 staining of tumors derived from MDA-MB-231 with PLK1 depletion and treatment PTX. (G) Expression of PLK1 in the METABRIC BRCA and TCGA breast cancer databases. (H) Overall survival of patients with breast cancer based on PLK1 transcription levels using the Kaplan-Meier plotter online tool. Scale bars = 1 cm (C), 50 μm (B and F). Error bars are mean ± SD.
METABRIC = Molecular Taxonomy of Breast Cancer International Consortium; PLK1 = polo-like kinase 1; PTX = paclitaxel; SD = standard deviation; sh-CTL = non-targeting shRNA; TCGA = The Cancer Genome Atlas.
*p < 0.05, †p < 0.01, ‡p < 0.001, and §p < 0.0001.

