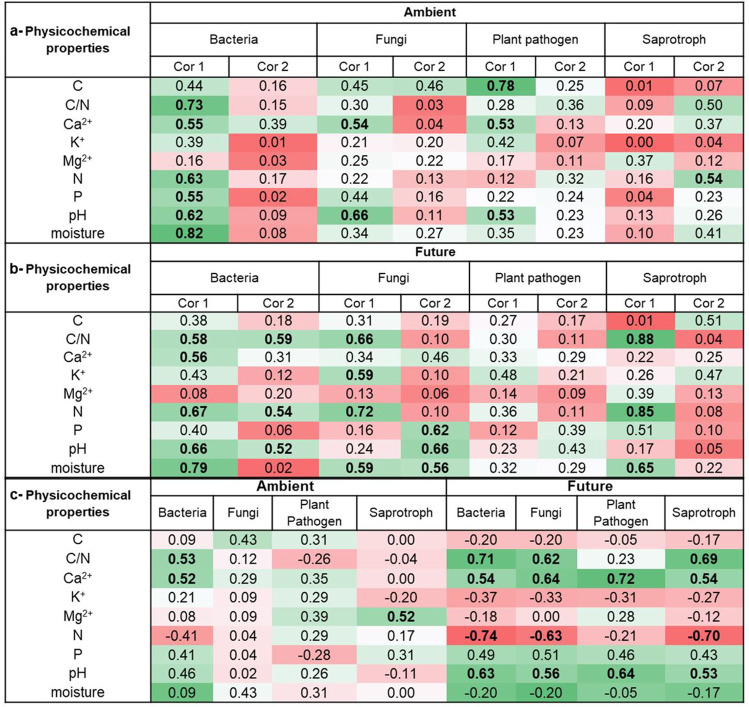
Table 2.
Heat table showing the correlation coefficient values between microbial communities (coordinate1 and coordinate2 of NMDS) and physicochemical properties under (a) ambient and (b) future climate conditions and between (c) microbial richness and physicochemical properties. Cor represents the coordinate. Significant values (p < 0.05) are indicated in bold. Bacteria = total bacteria, Fungi = total fungi, Plant pathogen = plant pathogenic fungi, Saprotroph = saprotrophic fungi. Green and red colours indicate values above and below 50th percentile, respectively

